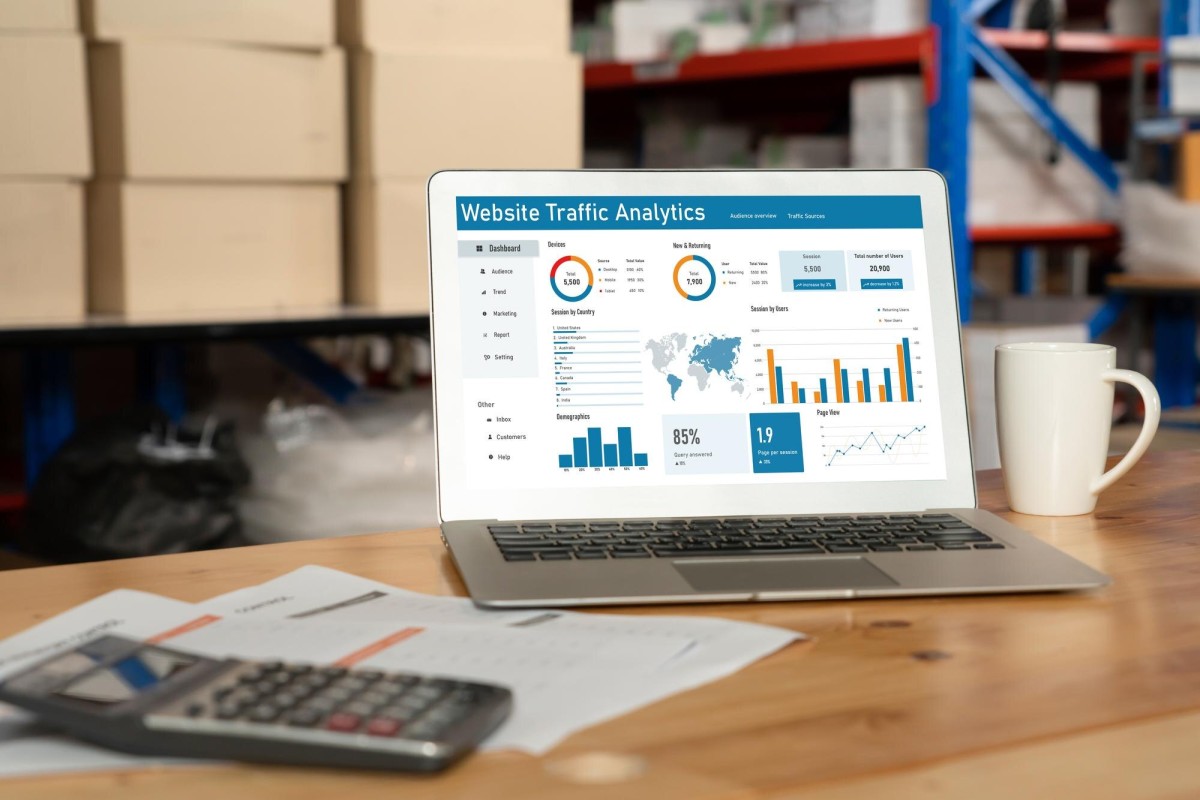
When you're selling a lot of different items on Amazon, you often want to be able to access data about different products and product sets on an individual basis. Amazon provides a lot of this data, but they're not exactly forthcoming with it. You have to know what you're doing and know where to look to find it. Let's talk about the various dashboards you might find useful.
Key Takeaways
- The Professional seller plan ($39.99/month) unlocks per-product sales reporting; Individual sellers cannot access these analytics natively.
- The "Detail Page Sales and Traffic By Child Item" report in Business Reports shows individual product sales data.
- Amazon lacks a built-in daily-per-product view; Excel pivot tables can manually reconcile these two separate datasets.
- Third-party tools like ManageByStats and Sellerboard pull SP-API data into dashboards showing profit after fees, refunds, and ad spend.
- Amazon publicly shows rough demand signals like "200+ bought in the past month," useful for competitive research.
Viewing Product Sales Data Individually
If you're selling more than one product and you want to see the sales data for each product individually in aggregate, you can do so using the Detail Page for Sales and Traffic report. You'll find it by navigating to Reports > Business Reports in your Seller Central dashboard, then selecting "Detail Page Sales and Traffic By Child Item" from the left-hand menu.
The trick here is that this information isn't available to every seller. Individual sellers, unfortunately, get the short end of the stick. In case you weren't aware, there are two seller plans on Amazon.
The Individual seller plan is for people who plan to sell fewer than 40 items per month. This refers to individual items sold, not types of products, so you can't build a storefront with 39 different products and consider yourself an "individual" seller if you're moving volume. Individual plans don't have a monthly subscription fee but carry a per-item selling fee plus variable closing fees.
The Professional seller plan is the one that unlocks additional seller dashboards and analytics. It's designed for sellers planning to move more than 40 items per month and carries a flat monthly subscription fee of $39.99, plus the standard variable fees.
What benefits do Professional sellers have?
- Access to detailed Business Reports, including the Detail Page Sales and Traffic report for per-product analytics.
- The ability to sell across all of North America (USA, Canada, and Mexico) from a unified account.
- Access to bulk listing and inventory management tools.
- Access to Amazon's Selling Partner API (SP-API) for advanced data integrations.
- The ability to customize shipping rates and carrier settings.
- The ability to create promotions, coupons, and offer options like gift messaging.
- Eligibility for top placement on product detail pages, including the Buy Box.
- Access to restricted product categories that require approval.
- Access to the Growth Opportunities tool, which shows the average number of daily views a product has received over the last 30 days, helping you identify where to invest your efforts.
That last category point is worth noting - certain categories such as automotive parts, clothing, grocery, and others require Amazon's approval before you can list. You can review the current list of restricted categories directly in Seller Central under your account settings.
It's also worth knowing that Amazon now publicly displays rough demand signals on many product pages, such as "200+ bought in the past month." While this isn't a replacement for your own sales analytics, it can be useful for competitive research when scoping out other listings in your niche. You can also tell which of your pages land the most sales by digging deeper into your traffic and conversion data.
If you don't have a Professional account, you won't be able to access per-product reporting natively. You'd have to manually comb through your order history and compile it yourself - a tedious process that underscores why most serious sellers upgrade quickly. Many sellers also look into ways of lowering their Amazon FBA seller fees once they make the switch to a Professional plan.
Viewing Product Sales By Day
Amazon does not provide a built-in way to cross-reference individual product performance on a day-by-day basis in a single view. If you view sales data day by day, you see everything in your store aggregated per day. If you look at per-product data, you see totals over time - but not a daily breakdown per product. Here's one way to reconcile those two datasets manually.
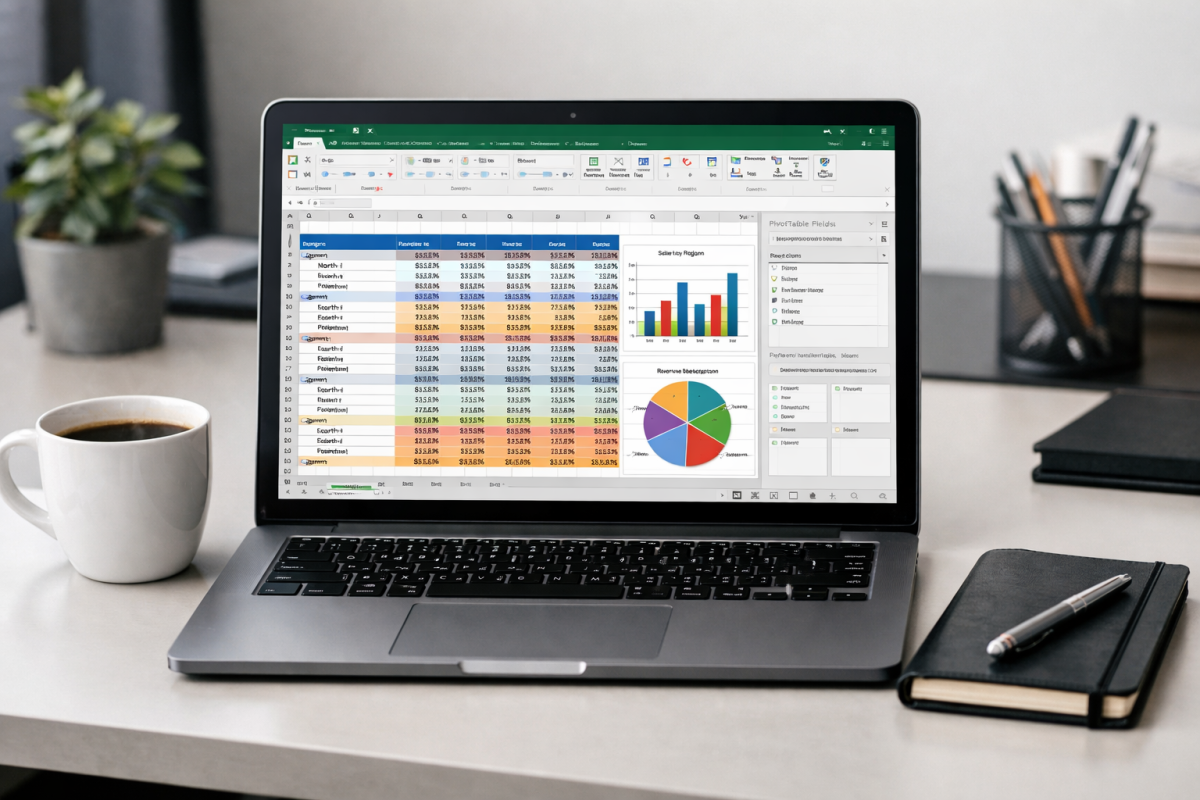
Microsoft Excel has a feature called a pivot table that can help bridge this gap. Pivot tables allow you to programmatically draw relationships between data sets so you can slice and dice the data without building individual charts for every variation you care about.
Here's a general workflow to view product data by day:
- In Seller Central, go to Reports > Business Reports and select your desired report, such as "Detail Page Sales and Traffic By Child Item." Set your date range and download the report as a CSV file.
- Import that CSV file into Excel (or Google Sheets, which handles pivot tables similarly).
- If date fields include timestamps, create a new "clean date" column using a formula to strip the time component - for example,
=LEFT(A2, 10)if your date is in ISO format, or use Excel's=DATEVALUE()function depending on your format. - Highlight your full dataset, then go to Insert > PivotTable and place it in a new sheet.
- In the PivotTable field list, drag your clean date field to Rows, your product title or ASIN to Columns (or also Rows if you prefer), and your units ordered or revenue to Values.
- You can now filter, sort, and view product performance broken out by day.
Keep in mind this is a static snapshot from the moment you exported the data. To refresh it, you'll need to re-export and re-import. For truly dynamic reporting, you would need to integrate with Amazon's Selling Partner API (SP-API) - the modern successor to the older MWS API - and build or use a tool that pulls data automatically on a schedule. If you're looking to grow beyond reporting, our ultimate guide to getting more sales on an Amazon store covers strategies worth exploring alongside your analytics work.
Recommended Tools

A lot of the data you might want simply isn't surfaced well inside Amazon's native interface. Third-party tools have stepped in to fill the gap, and there are more options than ever in 2026. Here are some worth considering.
Start with the FBA Revenue Calculator. This is a free Amazon-provided tool that helps you estimate the profitability of selling a product through Fulfilled by Amazon versus handling fulfillment yourself. Enter your product's selling price, cost of goods, and your own fulfillment costs, and it will show you a side-by-side profit comparison. It's a sales tool for FBA, sure, but the underlying math is genuinely useful when evaluating a new product or fulfillment strategy.
For repricing, look at tools like BQool or its competitors such as Seller Snap and Feedvisor (for larger operations). Prices on Amazon shift constantly as sellers compete for the Buy Box, and manually monitoring dozens of ASINs is not realistic. Automated repricers adjust your prices based on rules you define - target margin, competitive position, Buy Box eligibility - so you stay competitive without spending hours on it each day.
BQool in particular surfaces the data behind its decisions: competitor pricing, your ranking, fulfillment type comparisons, and repricing history. That transparency makes it easier to tune your strategy over time rather than just trusting a black box.
For cash flow, consider a service like Payability if you find Amazon's standard two-week payout cycle creates inventory bottlenecks. Payability advances you your earnings daily, in exchange for a percentage fee (typically around 2%). If you sell out of a product and need to reorder inventory immediately, having that cash on hand the next day rather than waiting for your next disbursement can be the difference between staying in stock and losing momentum.
Requirements typically include a minimum sales history of around 90 days and monthly sales volume above a minimum threshold. It's not for everyone - if you're well-capitalized, the fee isn't worth it - but for growing sellers in a cash-flow crunch, it can be a smart lever to pull.
For comprehensive analytics, tools like ManageByStats, Sellerboard, or Jungle Scout's Seller Suite pull your data from Amazon via SP-API and present it in an actually usable dashboard. You get daily, weekly, monthly, and annual views broken down by brand, product line, or SKU. You can track profit after fees, refunds, ad spend, and storage costs - not just gross revenue. This is a critical distinction, because Amazon's native reports don't net everything out for you automatically.
To put the opportunity in context: according to Amazon's own data, independent U.S. sellers averaged more than $290,000 in annual sales in 2024, and more than 55,000 sellers surpassed $1 million in sales that year. At that scale, flying blind without proper analytics isn't just inconvenient - it's actively costly. Whatever combination of tools fits your operation and budget, investing in real data visibility is one of the highest-leverage things you can do as an Amazon seller.