Key Takeaways
- GA4 classifies social traffic into Organic Social and Paid Social, viewable under Reports > Acquisition > Traffic Acquisition.
- Without UTM parameters, GA4 often mislabels social traffic as "Direct" or "(not set)," making social efforts appear less effective.
- Conversion tracking must be set up early since GA4 does not retroactively apply conversion data to past traffic.
- GA4's Explorations feature allows custom reports, like tracking what pages Instagram visitors view or how social visitors convert.
- Raw traffic numbers are vanity metrics; a smaller high-converting audience is more valuable than large zero-conversion traffic.
Google Analytics is a fantastic tool for measuring and tracking your audience, though many of the advanced reports and features require some setup to use. If you want to see specifically how your social media traffic is doing, you can do it, so long as you set everything up.
Note: This guide is written for Google Analytics 4 (GA4), which is the latest version of Google Analytics. If you're still running the older Universal Analytics, it has been sunset and you should migrate to GA4 as soon as possible.
Step 1: Install Google Analytics
If you already have a GA4 installation on your website, you don't need to bother reading this part. I'm just giving instructions for those who haven't done it yet and are looking to build their tracking setup from the ground up.
The first thing you need to do is sign up for Google Analytics. You can do that by visiting their main page and signing in with a Google account - it's free. You'll create a new account, then a property, and then a data stream for your website.
Once you're set up, you'll have to get the tracking code to add to your website. Google recommends Google Tag Manager to deploy your analytics code. Tag Manager is a container-based system that lets you manage Google Analytics, ads, and other tracking services in one area. Rather than pasting individual snippets into your site's code for each service, you add a single container snippet once and manage everything from the Tag Manager dashboard.

If you use WordPress, this is as easy as installing a plugin. MonsterInsights is one of the most popular options and connects GA4 directly to your WordPress dashboard. Its top referrals report even shows your top 10 social referral sources by default, which is helpful for a quick overview without leaving WordPress. If you're unsure what plugins to install on a new WordPress site, starting with an analytics plugin is a smart move.
To use Tag Manager, visit tagmanager.google.com and sign in. Create a new account and container for your website - this generates a container snippet - a small block of JavaScript - that you paste into every page on your website. Google recommends placing the first part of the snippet in the <head> section and the second part immediately after the opening <body> tag. From there, you set up a GA4 Configuration tag inside Tag Manager, point it to your Measurement ID, and publish.
If you use a managed website builder like Wix or Squarespace, look up their process for adding a GA4 tracking ID or Tag Manager container, as each platform handles this differently through their own settings panels.
If you'd like to skip Tag Manager entirely, you can paste the GA4 tracking snippet directly into the <head> of every page on your site. To find your snippet, log into Google Analytics, go to Admin > Data Streams, choose your web data stream, and copy the code under "Google tag." This works fine but means adding extra tracking services later will require going back and adding more code manually.
Step 2: Set Up Conversions and Key Events
An important part of tracking progress in GA4 is defining your conversions - previously called "goals" in Universal Analytics. GA4 works on an event-based model, which means nearly everything a user does can be tracked as an event, and you can mark the most important events as conversions.
It's important to do this early. GA4, like its predecessor, does not retroactively apply conversion tracking. If you haven't marked an event as a conversion, there's no historical data to pull from - tracking only starts from when you set it up.
To set up a conversion, go to Admin > Data display > Events. Find or create the event you want to track - like a form submission, purchase, or button click - and toggle it as a conversion. You can also go to Admin > Data display > Conversions to create new conversion events from scratch.
GA4 also supports assigning a monetary value to conversions, which is especially helpful if you want to measure the ROI of your content in dollar terms instead of raw numbers.
Step 3: Understand How GA4 Classifies Social Media Traffic
GA4 breaks down social media traffic into two categories:

- Organic Social - traffic coming from regular (unpaid) social media posts and profile links.
- Paid Social - traffic coming from paid social media advertising campaigns.
Within the Traffic Acquisition report, Organic Social is one of five primary session channel groups, alongside Direct, Organic Search, Referral, and Email. To find this report, go to Reports > Acquisition > Traffic Acquisition. From there you can filter, sort, and compare your social traffic against all other channels.
If you want to customize how GA4 classifies your social traffic - for example, to create custom rules for specific sources or campaigns - go to Admin > Data display > Channel groups. You can create a custom channel group with up to 25 channels for a fine-grained view of where your traffic is coming from.
Step 4: Use UTM Parameters to Track Social Links Accurately
One of the biggest sources of inaccurate social media data in GA4 is traffic being miscategorized. Without tagging, GA4 will label social traffic as "Direct" or "(not set)" - especially from mobile apps, link-in-bio tools, or URL shorteners - which makes your social efforts look less effective than they actually are.
The fix is UTM parameters - small tags you add to the end of your URLs before sharing them on social media. A tagged URL tells GA4 where the traffic came from, what campaign it belongs to, and what medium was used. Adding UTM parameters to a URL takes less than a minute with Google's free Campaign URL Builder. You can also learn how to use UTM parameters to track your blog traffic in more detail.
A basic UTM-tagged URL looks something like this:
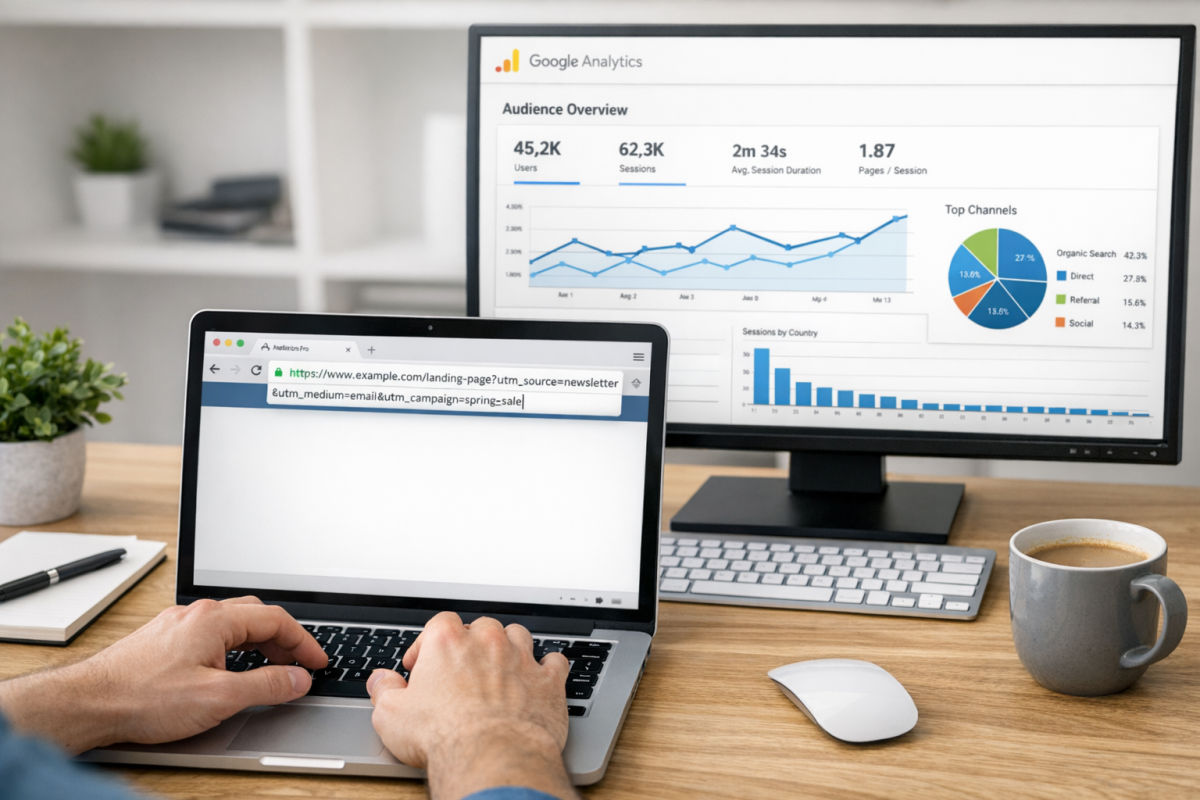
https://yoursite.com/blog-post?utm_source=instagram&utm_medium=social&utm_campaign=spring_sale
Every link you share on social media should have UTM parameters - it's the single most impactful step you can take to improve the accuracy of your social media traffic data in GA4.
Step 5: Explore the Key Social Media Reports in GA4
GA4 doesn't have the same dedicated social media report section that Universal Analytics had. But you can get equally - and in some cases more - detailed insights through a combination of standard reports and custom explorations.
The Traffic Acquisition Report is your starting point. Found under Reports > Acquisition > Traffic Acquisition, this report breaks down sessions by channel group - like Organic Social and Paid Social. You can see sessions, engaged sessions, engagement rate, conversions, and revenue - all filterable by date range and segment.
The Landing Page Report, found under Reports > Engagement > Landing page, shows you which pages users first arrive on from any traffic source - like social. Filter by session source to isolate social traffic and see which content is pulling them in, how long they stay, and whether they convert.
Explorations are GA4's version of custom reports and are more powerful than anything available in Universal Analytics. Go to Explore in the left nav and build a free-form exploration, funnel exploration, or path exploration. For example, you can build a path exploration that shows what pages users visit after arriving from Instagram, or a funnel exploration that shows how social visitors move through a multi-step conversion.
The Conversions Report under Reports > Engagement > Conversions lets you see which conversion events are firing and at what volume.

As always, raw traffic numbers are vanity metrics. A post that drives 10,000 visits with zero conversions is less valuable than a post that drives 500 visits and generates 50 leads. Use the conversion data to keep your social reporting grounded in business results. If you want to go further, check out these ways to convert your blog post traffic into sales.
The Realtime Report is also worth checking when you publish something new on social media - it shows active users on your site, where they're coming from, and what they're doing - helpful for immediately seeing if a post is driving traffic and how that traffic is behaving.
GA4 is a deep platform, and you're only scratching the surface with the built-in reports. The depth comes from custom explorations, audience segments, and combining your GA4 data with tools like Looker Studio (formerly Google Data Studio) to build shareable dashboards for stakeholders. Report templates are regularly shared in the GA4 community, so before building something from scratch, it's worth looking for a template that already does what you need. You may also want to explore how to see who has liked and shared your blog posts to complement what GA4 tells you about your social performance.