Along with bounce rate, visitor count and keywords, time on site is a prominent enough metric that it shows up across dashboards by default in Google Analytics (and GA4). It stands to reason that it's a valuable metric, and many marketers seem to love it. But what is it, how is it measured, and is it as valuable as it seems in 2026?
Key Takeaways
- Time spent on site is unreliable alone; different platforms calculate it differently, and GA4 replaced session duration with engagement time.
- Google Analytics counts all bounces as zero seconds, dramatically skewing average session duration downward for high-bounce-rate sites.
- Low time on site may mean poor content, satisfied users who found what they needed, slow page speed, or simply accurate normal behavior.
- Average time on site is 2 minutes 17 seconds; eCommerce averages 4 minutes, while grocery and utility sites average just 44 seconds.
- Interlinking posts, improving page speed, adding videos, and pairing time on site with scroll depth and conversion data improves accuracy and engagement.
What is Time Spent?

Time spent is a fairly self-explanatory metric. How long did the user stick around on your site, from the time they clicked a link to your page to the time they exited? It seems like a simple calculation.
There are, however, a few significant stumbling blocks.
- How do you track when the user exited, particularly if they didn't click an outgoing link to do so?
- When a user opens a link to your page in a new tab, how much of the time with the page loaded is actual time spent looking at the site?
- How can you tell the difference between a user who loads one page, reads it, and leaves, and a user who bounces immediately?
- How do you calculate time spent on site when a user opens multiple tabs on your domain?
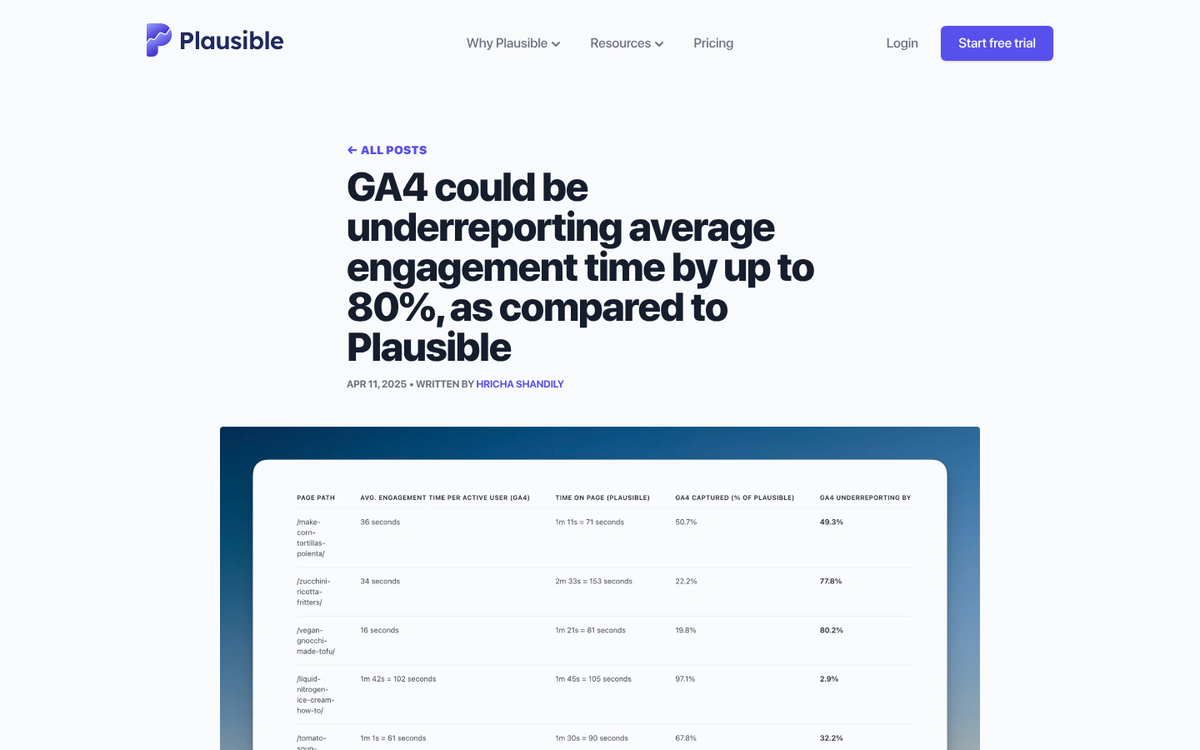
These are issues that obscure the validity of time spent on site. There's no single solution to these problems; different analytics platforms calculate time spent differently. This became even more pronounced with Google's migration to GA4, which replaced "average session duration" with "average engagement time" - a metric that only counts time when the page is actually in the foreground and the user is actively engaged.
Worth noting: Google Analytics counts all bounces as zero seconds in average session duration, which can dramatically skew that metric downward for any site with a high bounce rate. If you want to understand what's driving visitors away, it helps to know the top reasons website visitors bounce from a site. GA4 attempts to address this with its engagement rate model, but it's still an imperfect science - and there are valuable insights you can draw from your bounce rate beyond just the raw number.
The Argument Against Time Spent
Some will argue that time spent is not a reliable metric on its own. Consider this scenario:
- 1:04 the user clicks a Google result and visits your site.
- 1:05 the user clicks a headline from your blog to a post they want to read.
- 1:10 the user closes the browser, satisfied with their experience.
At 1:04, analytics records a visit beginning. At 1:05, it records the user clicking to a new page. That's it. There's no active polling to keep the session alive to see how long it lasts. The visit shows as one minute and reads like a short blip - even though the user spent five engaged minutes on your content.
Consider another scenario:
- 1:04 the user clicks a Google result and visits your site.
- 1:05 the user clicks a headline from your blog to a post they want to read.
- 1:10 the user gets up for a snack and steps away from their computer.
- 1:12 the user comes back and clicks to your homepage to see if there's anything else to read.
- 1:13 the user closes the browser.
One minute to find a headline, two minutes to read it, and a quick click to the homepage before leaving. Actual engaged time: roughly three minutes. But that five-minute snack break gets calculated into the session too, making the metric record eight full minutes of "engaged" time. Inaccurate, to say the least.
There are ways around this problem. One common approach is to actively ping the user at intervals to keep the session alive and better detect exit events. GA4's engagement model uses a 10-second minimum engagement threshold and tracks foreground activity, which is a step forward - but still far from perfect. Understanding how analytics records traffic can help you interpret these session metrics more accurately.
The Benefits of Time Spent
Time spent isn't a standalone actionable metric. You can't always see with total accuracy how long a user is spending on a specific page without additional tooling. That said, you can still learn a great deal from it in a general sense.
- Pages with a generally low time spent and a high bounce rate may not be satisfying your users' intent.
- Pages with a high time spent indicate successful, substantive content. When coupled with a low bounce rate and strong engagement signals, it shows you what content is genuinely resonating.
- Extreme amounts of referral traffic from a small handful of sources, all with near-zero time on site, is a reliable indicator of bot traffic.
To put some numbers behind this: users spend an average of 2 minutes and 17 seconds on a website. eCommerce sites do better, averaging close to 4 minutes, while news sites average around 2 minutes 30 seconds. B2B sites tend to have the highest average time on page at around 1 minute 37 seconds, while grocery and utility sites can average as little as 44 seconds. Knowing these benchmarks helps you put your own numbers in context rather than panicking over a metric that may be perfectly normal for your niche.
Why Time Spent is Low
So, back to the question in the headline. Why is your time spent on site metric so low? There are a wide range of possibilities.
- Your content is unsatisfactory and your users bounce immediately.
- Your users visit the specific page they want and don't click around your site, so no second event is logged to calculate time spent.
- Your content is great and well-presented, but your site doesn't facilitate further exploration, so users leave rather than dig deeper.
- Your site is slow. Pages loading within 2 seconds have a bounce rate of around 9%, but 40% of users abandon a site that takes longer than 3 seconds to load. A Google and Deloitte study found that even shaving 0.1 seconds off mobile load time reduced bounce rates by up to 5.7% on product listing pages.
- Your time spent on site is actually perfectly fine.
That last point might raise some eyebrows. The fact is, with all the measurement challenges described above, a seemingly low time-on-site figure is completely normal. Only the most content-rich, compelling sites encourage more than a few minutes at a time. Sometimes even the best pages only receive under a minute of genuine use - and that's okay if the user got what they needed.
So before you stress over the number, ask yourself: How accurate is your tracking setup? Are you using GA4's engagement metrics or still relying on old session duration data? Is time spent low because your content is thin, or because users got exactly what they came for and left satisfied?
Increasing Time Spent

Here are some practical tips for improving your time spent on site metrics.
- Interlink blog posts so users always have something relevant to click and read next.
- Make your site as easy as possible to navigate - friction kills dwell time.
- Prioritize page speed. Faster load times directly reduce bounce rates and keep users around longer.
- Add more content and more genuine value to your pages.
- Write longer, more thorough content where it's appropriate to the topic.
- Embed videos to significantly increase average engagement time. Explainer videos are a great place to start.
- Use GA4's engagement rate and engaged sessions metrics alongside time on site for a fuller picture.
- Don't rely on a single metric - pair time on site with scroll depth, engagement rate, and conversion data for real insight.
All in all, most of your standard SEO and content marketing best practices will naturally improve time on site as a byproduct. Don't obsess over the number in isolation - focus on delivering real value, and the metrics will follow.