Heatmaps are a technology that measures activity. They're very useful in a range of industries. Sports analysts can use them to study the areas of most heavy activity on the field. Mall administrators can use them to study traffic flows around their stores and booths. Video games can use them to improve map design. Web administrators can use them to see where people read and click on their pages.
Key Takeaways
- Heatmaps track clicks, scroll depth, mouse movement, and screen visibility, helping you understand how visitors interact with your site.
- Heatmaps reveal both high-performing elements and underused ones, like navigation buttons that waste valuable page real estate.
- Start heatmap tracking on your homepage first, then expand to product pages, landing pages, and other key sections gradually.
- Crazy Egg, Smartlook, and Heatmap for WP are solid free or low-cost options depending on your site's size and needs.
- VWO Insights pairs heatmaps with A/B testing; one case study showed a 12.37% increase in form sign-ups after testing.
How to Use a Heat Map
Heat maps will give you a lot of data about how people use your website. Essentially, it adds an overlay over the top of your site, so that every time a user clicks, that click is recorded. Some will also cover screen visibility, scroll depth, or mouse movement, rather than just clicks. In 2026, the best tools combine all of these into a single dashboard, making it easier than ever to get a complete picture of user behavior.
You can use this data to see what users are clicking on your page. You might discover, for example, that a ton of users think the preview pictures above your article titles are links and click them all the time, only to be forced to click the title below to get to the actual post. You might find that you're diffusing user attention over too many options on a given page, when you should be focusing on a certain handful of key links.
One interesting use comes from those "related post" widgets you see so often, displaying preview pictures for half a dozen related articles. You can use heatmaps to test various images, to see which pictures are most interesting to readers, and which get the most clicks. This helps you pick better pictures for your posts and drives more internal traffic.
Heat maps are also notable for what they don't show. If you have five buttons on your navigation bar, but one of them is virtually never clicked, you'll see that as well. That's a prime piece of web real estate that could be optimized with a better link to better content, or removed entirely to avoid distracting readers. If you're looking for options, check out some good free website heatmap tools to get started without spending anything.
Implementing Heat Maps

The first step to using a heatmap properly is figuring out where to put it. You shouldn't automatically install it on every page on your site, because you'll end up with more data than you know what to do with. Then, when you make a change to one page, it can change how users interact with other pages, invalidating old data.
You should probably start with your homepage. From there, you can branch out to your product pages, your navigation across your blog, your specific landing pages, your FAQ, your testimonials, your contact pages and so forth.
When you're analyzing the data, you have to ask yourself a few questions about your pages, their purposes and the data you received. You might ask:
- What is the primary purpose of this page?
- Given the primary purpose, where should the majority of users click?
- Given the data, where are users actually clicking?
- What can you do to refine where users click, to guide them to specific buttons, narrow their choices, or reorganize the location of information?
In general, you'll probably discover that wide menu bars tend to be distracting and users don't use most of the available options. Images tend to be clicked a lot, with users expecting to visit the source of the image or a related post. Sidebars have fallen victim to ad blindness the same way banner ads have. CTAs work both above and below the fold, so don't skimp on placement just to cram one in above. If you want to understand which pages are actually driving revenue, it helps to know how to tell which of your pages land the most sales. These patterns have held true for years, and heatmap data from 2025 and 2026 continues to confirm them.
The Best Heat Map Tools in 2026
With that in mind, here is a handful of good heat map programs worth considering. If you're also looking for ways to improve your overall marketing stack, check out our list of completely free marketing tools that can complement your heat map strategy.
Crazy Egg
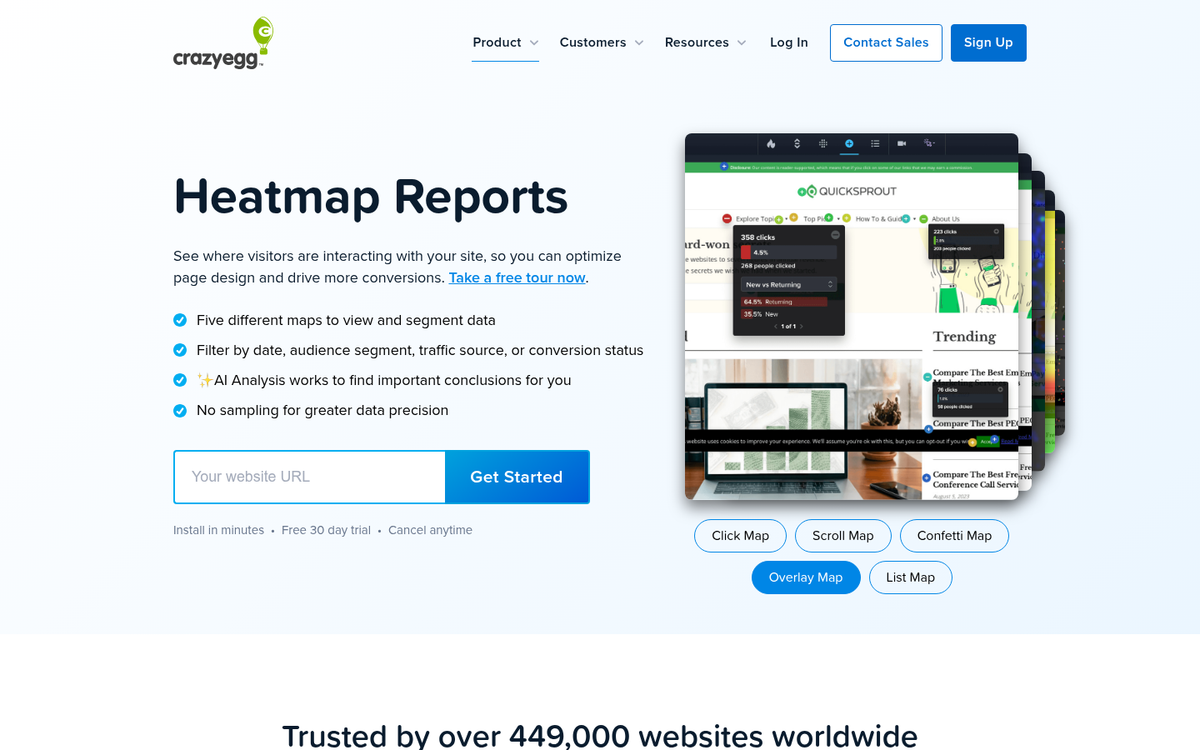
You're crazy if you don't think Crazy Egg should be at the top of this list. In addition to the standard click-based heat maps, Crazy Egg also generates heat maps based on the user's scroll depth. You can see how many people scroll down how far and how often, so you know just how much or how little attention is being paid to the bottom of your pages.
One standout feature of Crazy Egg is the Source Heat Map. This heat map shows click locations and densities, but it sorts and color-codes them based on their referrer. You'll be able to see, for example, if visitors from Facebook, visitors from Google search, and visitors from other sources behave differently when they land on your site.
Crazy Egg offers a free first month, which is a great way to test out a piece of analytics software before committing. Paid plans start at $9/month, which is still very reasonable for most bloggers and small businesses.
Smartlook
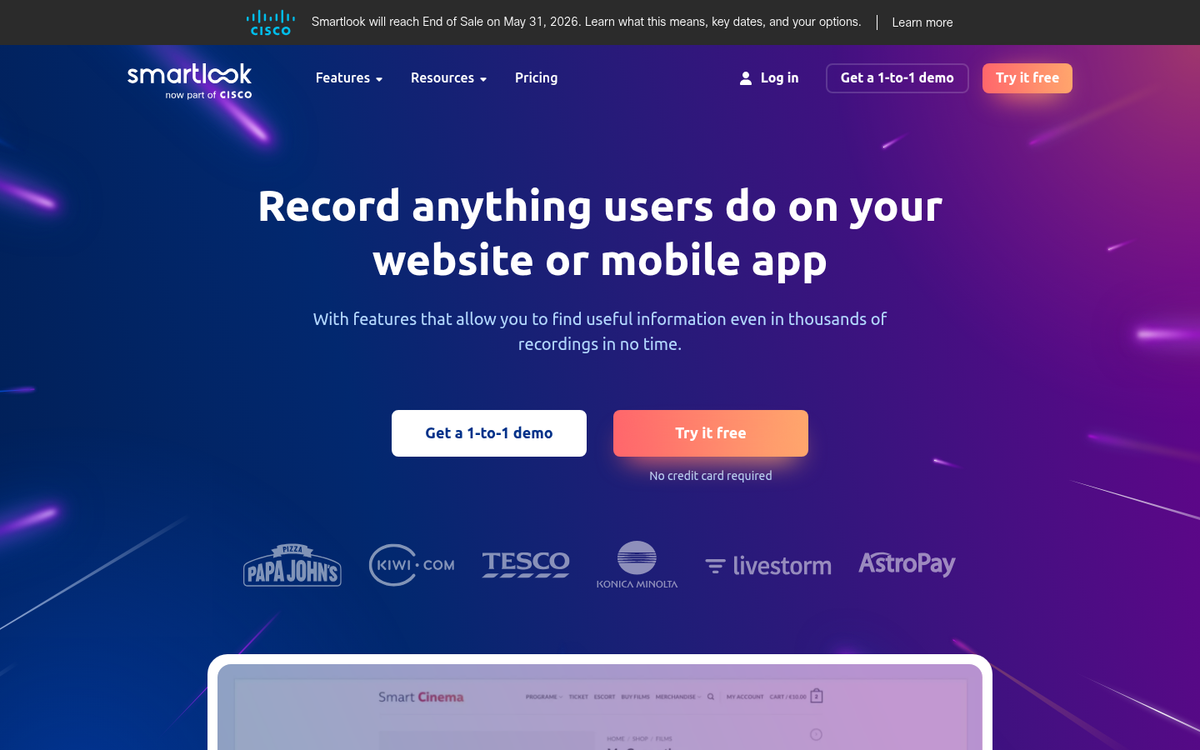
Smartlook has matured into one of the more capable heatmap and session recording tools available in 2026. It combines heatmaps with full session recordings, funnels, and event tracking, making it a solid all-in-one option for those who want to use heatmaps to increase sales. Their free basic plan includes up to 35 daily sessions, which is enough to get your feet wet without spending a dime. If you want more, they offer a 30-day free trial with up to 3,000 monthly sessions, giving you a meaningful amount of data to work with before deciding whether to upgrade.
Contentsquare
Previously known as ClickTale before being acquired and rebranded, Contentsquare sits at the enterprise end of the spectrum. This platform is significantly more robust than Crazy Egg or Smartlook, offering deep behavioral analytics, session replays, zone-based heatmaps, and AI-powered insights. It's built for larger teams and bigger budgets, and pricing reflects that. If you're running a high-traffic e-commerce site or a large content operation, it's worth a look. For most bloggers and small businesses, the tools above will serve you just fine.
VWO Insights
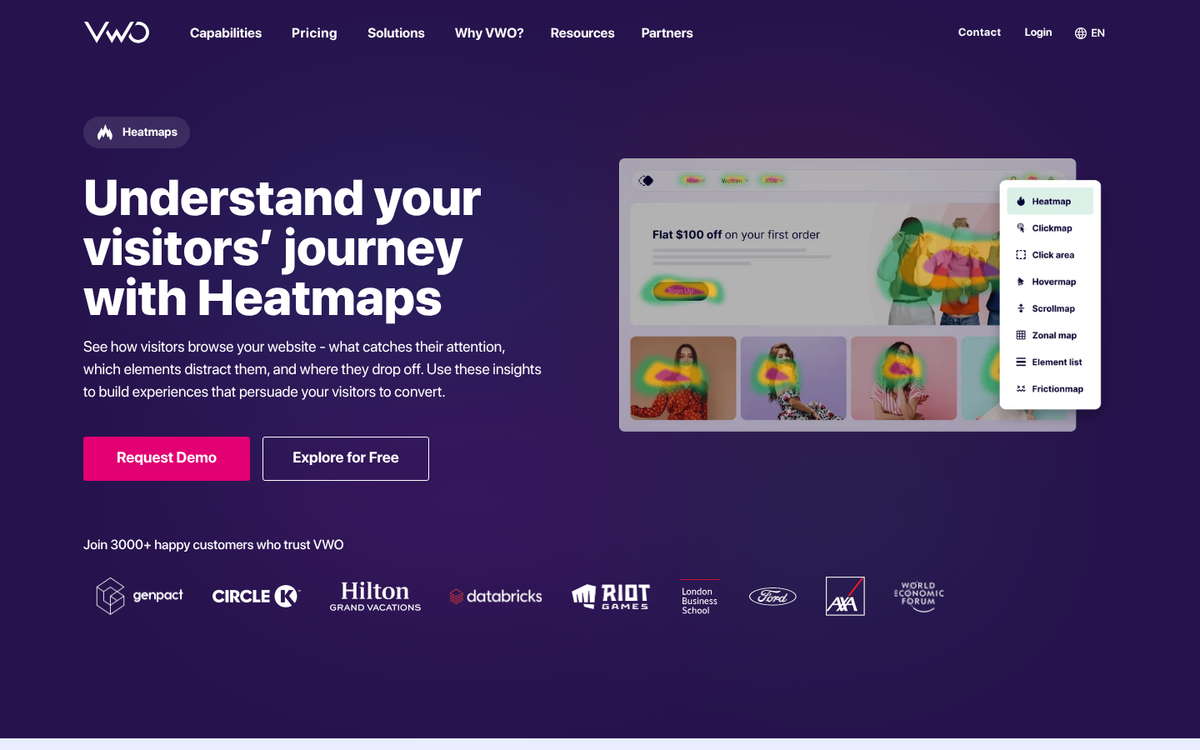
VWO Insights (part of the broader VWO optimization platform) is worth mentioning because it pairs heatmaps directly with A/B testing. The results can be impressive - Microfocus, an FTSE 250 software company, used VWO's heatmaps, scroll maps, and session recordings to identify friction points in their sign-up flow, ultimately achieving a 12.37% increase in form sign-ups after A/B testing their changes. If you're serious about conversion rate optimization and want your heatmap data to feed directly into split testing, VWO is a strong option to consider.
Heatmap for WP
If you're running a WordPress site and just want something simple that works without leaving the dashboard, the Heatmap for WP plugin is still worth a mention. It's basic, it tracks clicks in real time, it doesn't sample your data, and it integrates cleanly with WordPress. It won't replace a dedicated tool like Crazy Egg or Smartlook, but for a lightweight free option that lives right inside your existing setup, it does the job.