Key Takeaways
- Average CTR varies widely: search ads average 6.64%, display ads just 0.57%, with industry and ad position dramatically affecting results.
- Ad position is critical - rank #1 search ads average 7.11% CTR, while rank #9 ads average only 0.55%, a 12x difference.
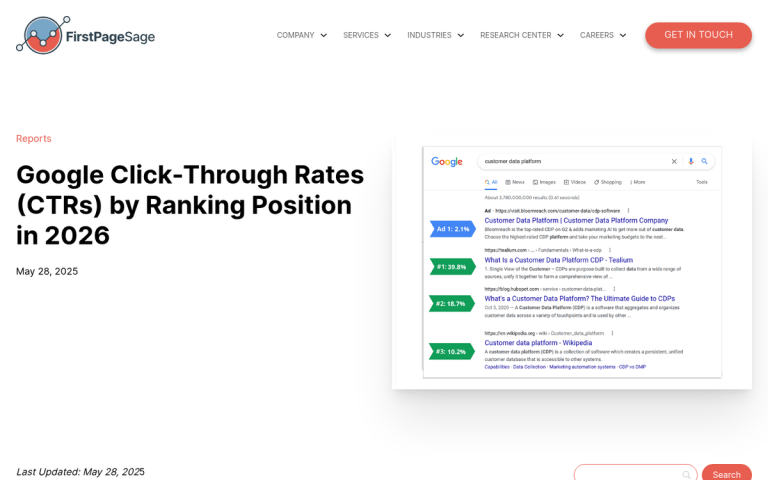
- Organic search far outperforms paid ads on CTR, with the top-ranking Google result averaging a 45.6% CTR.
- Key factors influencing CTR include ad relevance, device type, search intent, targeting precision, and ad creative freshness.
- CTR shouldn't be tracked in isolation - conversion rate, cost per action, and impression share all provide essential context.
Click Through Rate Optimization: What Actually Works in 2026
Click through rate is an important metric. It's the percentage of people who click your ads and land on your landing page, out of all the people who see your ads. Obviously, it's a good idea to boost that number, right?
There are other considerations, of course. A CTR of 100% would be completely valueless to you if your total audience was 1 person. A CTR of 100% is also completely valueless no matter how large your audience is if your conversion rate is 0. However, you probably know all of this already. CTR is not the metric you want to die on, but it is an important metric, and it's one you should know how to optimize.
The first part of optimization is understanding. So what affects your CTR? What's the process, and what options do you have for improving it?
A String of Numbers
What's an average click through rate? The numbers have shifted significantly since the early days of digital advertising, and if you're still benchmarking against figures from five or ten years ago, you're working with a broken compass.
Based on current data, the average CTR across all industries sits at 6.64% for search ads and just 0.57% for display ads. Those two numbers tell a very different story depending on where your campaigns live. Search ads benefit enormously from intent - someone typed something into Google and they're actively looking for an answer. Display ads are interruptions, which is why the CTR is so much lower.
Industry matters a lot here too. Arts and Entertainment tops the charts at 11.43% CTR on search ads, while more commoditized or price-sensitive verticals tend to lag behind. If you're in a lower-performing industry, don't panic - a below-average CTR in a high-competition vertical can still mean a profitable campaign if your conversion rate and cost-per-action are solid.
Ad position is one of the most dramatic levers in the game. According to AccuraCast, rank #1 search ads average a 7.11% CTR, while rank #9 ads limp in at just 0.55%. That's more than a 12x difference based on position alone. If you're bidding to appear at the bottom of the paid results, you're essentially paying for near-invisibility. Learning how to get a lower click cost on AdWords can help you compete for better positions without blowing your budget.
Organic search still blows paid out of the water in raw CTR terms. The top-ranking organic Google result averages a 45.6% CTR, with the #2 result pulling in 12.3%. The gap between organic position #1 and everything else is staggering, which is why SEO isn't going away anytime soon even as paid competition intensifies.
On social media, the picture changes considerably. Twitter/X ads average around 2.00% CTR, while LinkedIn sits at the bottom of the pile at just 0.06% - though LinkedIn's strength is in lead quality rather than volume, so that number isn't as grim as it looks in isolation. Facebook's CTR varies by industry, with apparel and footwear leading the pack at around 2.06% CTR according to Statista data. If you're running social campaigns, Twitter Website Card Ads can be a practical way to increase CTR.
Email marketing rounds out the picture. An analysis of over 3.6 million campaigns found a global average email click rate of 2.09%, ranging from 0.83% on the low end to 4.90% for top performers. Email still punches well above its weight relative to display advertising.
My general rule of thumb: if your search ads are sitting below 3-4%, there's room to improve. If your display ads are above 1%, you're doing well. And if your organic CTR is below 2%, your title tags and meta descriptions need work.
Factors Affecting Click Through Rates

So what goes into your CTR, and how can you influence those factors to get more out of your ads? Higher CTR comes from better ads, but there's more to it than that. Let's look at each factor individually.
Organic vs. Paid. Organic results consistently outperform paid ads on CTR, and the gap is substantial. The reasons haven't changed much: organic results are perceived as more trustworthy, they tend to match intent more precisely, and a significant chunk of users actively avoid clicking ads. Ad blockers remain a factor too, sometimes registering impressions for ads that users never actually see. That said, paid search excels at capturing high-commercial-intent queries where users are ready to buy, so the lower CTR doesn't always mean lower ROI.
Platform: Google, Meta, LinkedIn, and Beyond. Different platforms produce wildly different results, and you need to benchmark against the right one. Google Search ads are intent-driven and currently average 6.64% CTR across industries. Meta (Facebook and Instagram) ads are interest- and behavior-driven, with CTRs typically in the 1-2% range depending heavily on creative quality and audience targeting. LinkedIn is a specialist tool with very low CTR but high B2B lead quality. TikTok and YouTube ads behave more like display than search, with correspondingly lower CTRs but strong reach for brand-building.
Ad Relevance to Query or Audience. The more relevant the ad is to what someone is searching for or interested in, the higher your CTR will be. This has always been true, but Google's systems in 2026 are sophisticated enough to penalize you meaningfully if your ad relevance scores are weak. Match your headlines to the query, use dynamic keyword insertion where appropriate, and make sure your ad speaks to what the user actually wants - not just what you want to sell them.
Ad Position. As covered above, position is one of the single biggest drivers of CTR in search advertising. The difference between rank #1 and rank #9 is more than 12x in click rate. Bidding strategies, Quality Score, and ad relevance all feed into your position. Improving your Quality Score through better ad copy and landing page alignment can earn you better positioning without simply outspending competitors.
Ad Type: Responsive, Image, Video, or Text. Responsive Search Ads (RSAs) have become the standard in Google Ads, allowing the platform to mix and match headlines and descriptions to find the best-performing combinations. This has generally improved CTRs for advertisers who populate their RSAs with strong, varied assets. On display and social, video creative consistently outperforms static images for engagement, though the CTR gap between video and static has narrowed as feeds have become more video-saturated and users have grown more selective.
Banner Blindness and Ad Fatigue. Banner blindness is as real as ever. Traditional rectangular display ads in predictable locations get scrolled past without a second thought. Native advertising and in-feed formats continue to outperform traditional banners because they don't scream "advertisement" at first glance. On social media, ad fatigue sets in faster than most marketers expect - if someone has seen your creative three or four times without acting, they're unlikely to start clicking now, and frequency capping is your friend.
Device: Desktop vs. Mobile. Mobile now dominates internet traffic in most industries, and ad formats have largely adapted to reflect that. Mobile CTRs on search tend to be slightly higher than desktop for local and transactional queries, while desktop still holds its own for complex B2B or research-heavy searches. If your campaigns aren't segmented by device with tailored bids and creative, you're leaving performance on the table.
Industry. As mentioned, your industry sets the baseline expectations for your CTR. Arts and Entertainment sits at 11.43% for search; legal, financial services, and B2B technology tend to cluster at the lower end. Always benchmark your CTR against your specific vertical rather than a global average - you'll get a much more honest read on where you actually stand.
Search Intent: Informational vs. Transactional. The type of query matters enormously. Someone searching "how do I fix a leaking pipe" is in informational mode - they want a guide or a video, not a paid ad for a plumber (though local service ads can still perform here). Someone searching "emergency plumber near me" is ready to act, and a well-placed ad is going to get clicked. Aligning your paid campaigns to transactional and commercial intent queries will always produce better CTRs than chasing informational keywords.
Urgency and Local Intent. Local searches with clear urgency - restaurants, emergency services, same-day delivery - consistently produce higher CTRs than broad, national, or evergreen searches. If you serve a local market, make sure your ads reflect that with location extensions, local inventory callouts, and copy that emphasizes proximity and immediacy.
Targeting Precision. The more tightly you define your audience, the smaller the pool but the more relevant your ad becomes to each person in it. Tighter targeting almost always improves CTR. Google's audience targeting, Meta's detailed interest and behavioral layers, and LinkedIn's job title and company filters all let you get very precise. The tradeoff is scale, but for most advertisers, a smaller highly-targeted audience outperforms a massive broad one on every metric that matters. If you're also exploring buying leads from performance advertising companies, targeting precision matters just as much there.
Age of the Ad Creative. Fresh creative consistently outperforms stale creative. This is especially true on social platforms where the same users see your ads repeatedly. A rule of thumb: if your frequency is above 3-4 and your CTR is declining, it's time to refresh the creative. On search, this dynamic is less pronounced since ads are triggered by queries rather than pushed to the same audience repeatedly, but even search ad copy benefits from periodic testing and refreshing.
Other Metrics to Consider
In addition to the factors that directly affect click through rate, you also have to take other metrics into account. It's one thing to have a high click through rate, and it's quite another to be stuck with an extremely low number of conversions.
This will affect a variety of things with your marketing, foremost among them being your Quality Score on Google Ads. Google tracks whether your clicks are leading to meaningful engagement on your landing page, and if users are bouncing immediately, that's a signal something is wrong. A weak landing page experience drags down your Quality Score, which raises your costs and can hurt your ad positioning - a double penalty for the same mistake.
Here are a few metrics worth tracking alongside your click through rates.
CTR Compared to Competitors. A 4% CTR might sound great until you find out your main competitor is averaging 7% on the same keywords. Competitive benchmarking tools like Google Ads' Auction Insights report, SEMrush, or SpyFu can give you a clearer picture of how your performance stacks up. It's not just about the absolute number - it's about where you sit relative to the competition for the same eyeballs.
Conversion Rate. Clicks mean nothing if they don't convert. A campaign with a 2% CTR and a 10% conversion rate is almost certainly outperforming a campaign with an 8% CTR and a 1% conversion rate. Always track both metrics together. If your CTR is strong but conversions are weak, the problem is almost always on the landing page - the ad is doing its job, but the page isn't closing the deal.
Cost Per Action. Ultimately, profitability is the scoreboard. You need to know your cost per click, cost per lead, and cost per acquisition, and you need to know whether those numbers are sustainable relative to your margins. A high CTR that drives expensive, low-quality clicks can cost you more than a lower CTR that brings in fewer but better-qualified visitors. Keep your eye on cost per action as the north star, with CTR as one of the inputs that helps you get there.
Impression Share. If your CTR looks fine but your overall traffic from paid search is disappointing, check your impression share. You might be winning the clicks you're eligible for, but not showing up for as many auctions as you could be. Lost impression share due to budget or rank tells you exactly where to focus your optimization efforts next. Seasonal budget pressure can also quietly erode your impression share without it being immediately obvious in your CTR data.