


Heatmaps are excellent tools for optimizing your website in ways you might not otherwise think to do. If you're not sure how they work or how they can help, read on; if you already know, skip ahead to our heatmap recommendations.
Key Takeaways
- Microsoft Clarity is the top free recommendation, offering unlimited traffic, click heatmaps, session recordings, and AI summaries at no cost.
- Free heatmap tools have improved significantly; the gap between free and paid options has narrowed considerably by 2026.
- Heatmaps reveal user behavior like clicking non-linked elements or ignoring CTAs, helping improve conversions through data-driven changes.
- Crazy Egg no longer offers a free plan, with paid plans now starting at $99/month, making it harder to recommend for most users.
- Free plans from Hotjar, Mouseflow, Lucky Orange, and others vary in session limits, data retention, and traffic caps, suiting different site sizes.
How Heatmaps Work
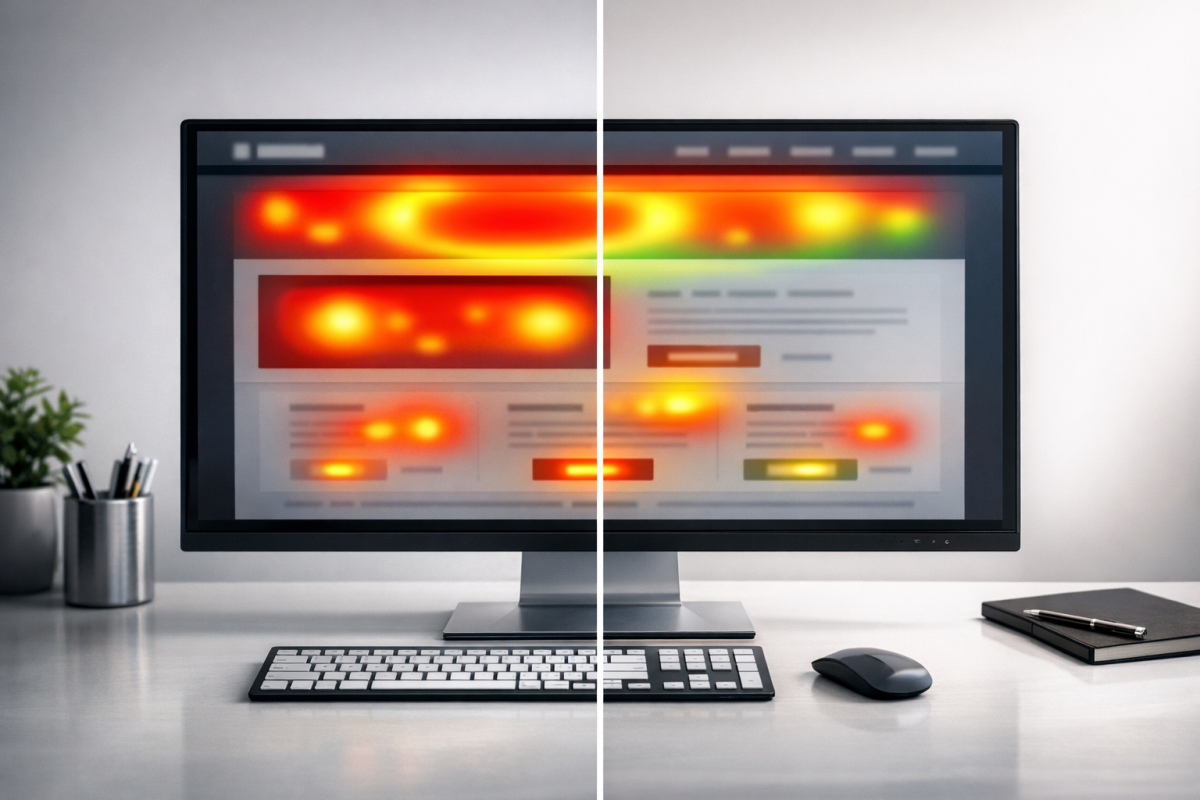
Heatmaps in various forms are used globally. Some literally use heat tracking to monitor activities of people or even organs within a person, medically. More often, a heatmap is used to monitor activity. The more dense the activity in an area, the "hotter" the area is. Foot traffic across a college campus can be monitored, vehicle traffic throughout a city can be monitored, and so on.
On a website, a heatmap monitors cursor and/or screen activity. Most simple heatmaps monitor clicks. Each click on the site is one data point. The more clicks there are on a specific area, the "hotter" that area is. Many heatmaps will look much like the examples on this page.
English language readers start at the top and read down, and start at the left and read right. Thus a heatmap for Google's search results will have the largest density of activity - the heat - in the upper left of the page, with the most clicks on the first result. As you progress to further results and other page elements, heat density drops.
There are some drawbacks to heatmaps, primarily based in the assumptions one makes about data. You can read more about those on the example page I linked above. We're not super concerned with the drawbacks of heatmaps in general, though. If you're going to use a heatmap, you're going to need to understand how they work well enough to actually interpret the data, and doing that will depend on the software you choose to use.
On a technical level, a heatmap is generally a script that runs on a page, tracking aggregate data about clicks on the page. Some are more sophisticated than others, but they all generally monitor user session information to help you get an idea of how users are interacting with your page.
Using Heatmaps to Improve a Site

Imagine a scenario where you looked at the heatmap of a page and found that a huge proportion of users were clicking on something that isn't actually a link. Since users are clearly expecting it to be clickable, that's valuable intent you're failing to capture. You could investigate, make that element a link, and immediately improve the user experience.
This is exactly the kind of implementation heatmaps are built for. They allow you to see where users are clicking, where they're scrolling, and where they're dropping off. You can find usability issues and lost opportunities that raw analytics would never surface.
For example, imagine you have a top bar navigation with four options, and then a graphic that advertises another service on your site. If that graphic is not a link, you might discover that a lot of users are clicking on that image hoping it will be a link, only to find that nothing happens. You can capture all of that user intent simply by making that image a link.
Conversely, if you have three links in a piece of text and virtually no one clicks the third one, you might investigate why. Maybe it's too small, maybe the call to action isn't compelling, maybe it's positioned below where most users stop scrolling. The point is, you know users aren't clicking it, so you can look into what the problem might be.
Real-world results back this up too. Microfocus, an FTSE 250 company, used VWO Insights heatmaps to identify friction in their sign-up forms, ran A/B tests based on those findings, and achieved a 12.37% increase in form sign-ups. That's a meaningful business result driven entirely by heatmap data.
In any case, this post isn't meant to dive deep into every way you can use heatmaps - I'm just giving you a few examples. Many of you came here because you already know the value of heatmaps, and you want to know if there are any good free options. So, let's get into it.
Free Versus Paid
Heatmap software is often sophisticated and complex, by necessity. Think of how many dynamic elements are on a page. Check out this page and then mouse out of it - you see that pop-over? My heatmap would show a large spike of activity where the X on that box is, as people click to close it. If the heatmap software snapshots the page without that pop-over, I might wonder why a ton of people are clicking on whatever is under that X at the standard resolution. A good heatmap app will be smart enough to show a session replay rather than just static data, and can show when data is associated with specific dynamic elements.
Free heatmap apps are generally going to be less sophisticated. Any app with more features is going to be more valuable and thus can charge more. There are exceptions, but those aren't necessarily the norm.
Should you use a free app or a paid app? That's up to you and the data you think you can get out of it. If your site is generally static rather than dynamic, and if you don't need advanced session replay features or dynamic tracking or heatmap split testing, you can probably get away with a free heatmap. If you have a complex setup and need specialized monitoring, you might only find it with paid apps.
The Gold Standard
Before getting into free options, I have to mention the paid options worth knowing about. Crazy Egg has long been considered one of the best website-based heatmaps in the industry, with session tracking, snapshots, recordings, split testing, and compensation for dynamic elements.
However, their pricing has changed significantly. As of 2026, Crazy Egg no longer offers a free plan, and their paid plans start at $99/month for the Plus plan, going up to $499/month for Enterprise. They do offer a 30-day free trial, so you can still test the waters before committing.
Given that pricing, Crazy Egg is harder to recommend as a starting point compared to what it once was - especially when there are now genuinely excellent free tools available (more on that below). If budget isn't a concern and you need enterprise-level features, it's still worth evaluating. But for most people, the free tools available in 2026 are remarkably capable.
Hotjar is the other major name in the space. Their paid plans start at $32/month (billed annually) for up to 100 daily tracked sessions, and they do have a free forever plan as well (details below). For mid-size sites that need reliable data without enterprise pricing, Hotjar is a strong contender.
Free Heatmap Apps
Since you're here looking for free options, let me be upfront: the landscape has genuinely improved. In 2026, there are some very capable free heatmap tools - the gap between free and paid has narrowed considerably, though limitations still exist. Here's what's worth your time.
Microsoft Clarity is the standout recommendation for most people in 2026. It is completely free, forever, with no traffic limits. That alone puts it in a category of its own. Clarity offers click heatmaps, scroll maps, session recordings, rage click detection, dead click tracking, and even an AI-powered summarization feature that can describe what users are doing in plain language. It integrates directly with Google Analytics, which makes it even more powerful as a combined analytics solution.
The trade-off? It's a Microsoft product, so you'll want to review their data privacy terms and ensure compliance for your audience, particularly if you serve EU users under GDPR. But from a features-per-dollar standpoint - and that dollar is zero - nothing else on this list comes close. If you only try one tool from this list, make it Clarity.
Hotjar also has a free forever plan, though it's quite limited. You can track up to 35 daily sessions, which works out to roughly 1,000 sessions per month. For high-traffic sites, that's not much. But for smaller sites or those just getting started, it's enough to gather meaningful directional data. The free plan gives you access to click heatmaps, scroll maps, and move maps, plus session recordings - so the feature set is solid even if the volume is capped.
Mouseflow offers a free plan that includes 500 session recordings per month, tracking one website with one month of data retention. You also get access to their heatmap suite, which includes click, scroll, movement, attention, and geo maps. The one-month data retention is a real limitation for trend analysis, but for monthly review cycles it's workable. Their paid plans are reasonably priced if you grow into them.
Lucky Orange has a free plan that supports 500 page views per month. That's genuinely low and really only suitable for very small or newly launched sites. However, what you get within that cap is impressive: dynamic heatmaps, session recordings, live visitor view, conversion funnels, and form analytics. If your traffic is modest, Lucky Orange punches well above its weight. If you want to track your website visitors in real time, the live visitor view feature is especially handy.
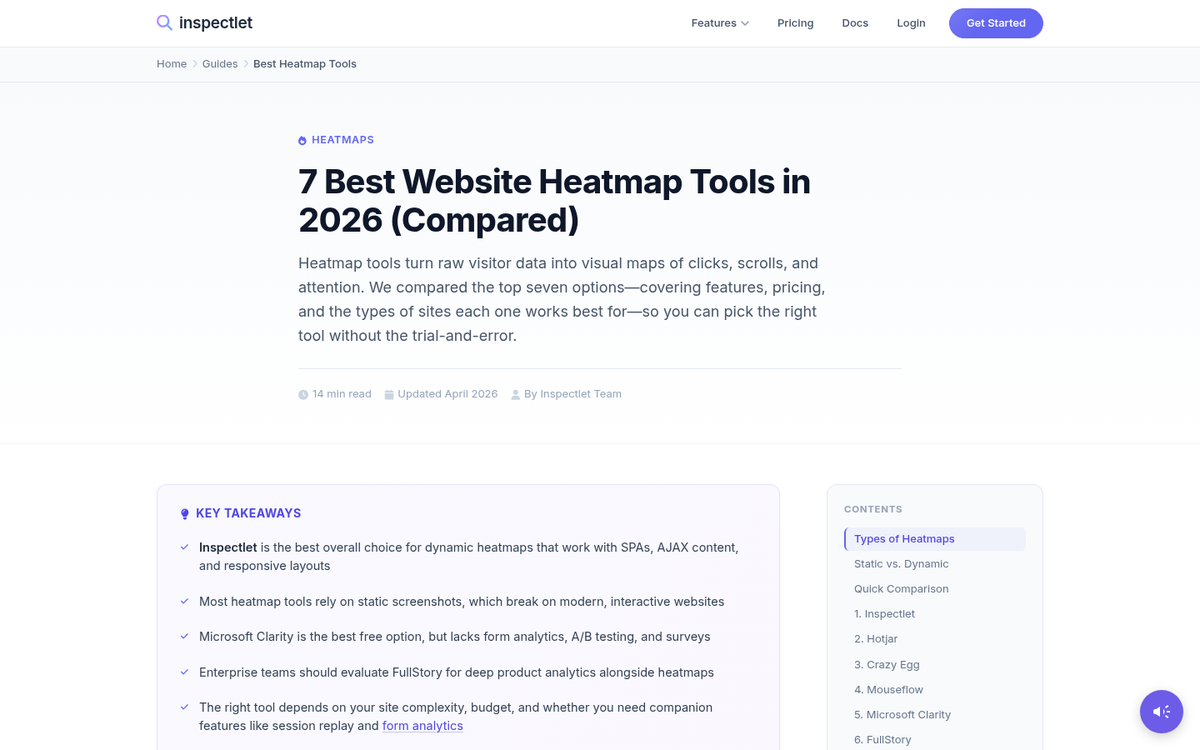
Inspectlet offers a free plan with 25,000 page views per month, which is one of the more generous traffic allowances in the free tier. You get session recording and heatmaps, though the free plan limits you to a smaller number of recorded sessions and one site. It's a solid middle-ground option if you need more pageview capacity than Lucky Orange but don't want to commit to a paid plan.
Plerdy has a Free Forever plan that includes approximately 100 heatmap daily views and around 500 video/session replay captures. It also includes SEO checker tools and pop-up functionality, making it a more well-rounded free package than some alternatives. Worth exploring if you want a broader toolkit alongside your heatmap data.
Smartlook rounds out the list. They offer session recordings, heatmaps, event tracking, and funnel analysis. Their free plan has limitations on data history and the number of heatmaps you can maintain simultaneously, but they support a reasonable monthly session volume. It's worth checking their current free tier directly, as their plans have evolved over time. If you're also looking for free alternatives to Google Analytics, several of these tools pair well with standalone analytics platforms.
Do you know of another free heatmap option I missed? I'm specifically interested in tools with genuine free plans - not just free trials. Drop a note in the comments and I'll check it out.


3 responses
Thoughtful replies only - we moderate for spam, AI slop, and off-topic rants.
Thank you for your article. It has helped.
How about Yandex Metrica?
Great call, Daryl! Yandex Metrica is definitely one of the best free heatmap tools out there and probably should have been mentioned in the article. It offers click maps, scroll maps, and even session recordings at no cost, which is pretty impressive. The only hesitation some people have is around data privacy since it's a Russian-based platform, but functionality-wise, it's hard to beat for free!