Timing matters. You can't catch a ball if you raise your hand too late. You can't make it to the elevator if you start when the doors are closing. You can't gain the attention of your online audience if you're posting when they're all asleep. To this end, it's a good idea to learn when your audience is the most active and how you can take advantage of that activity.
Key Takeaways
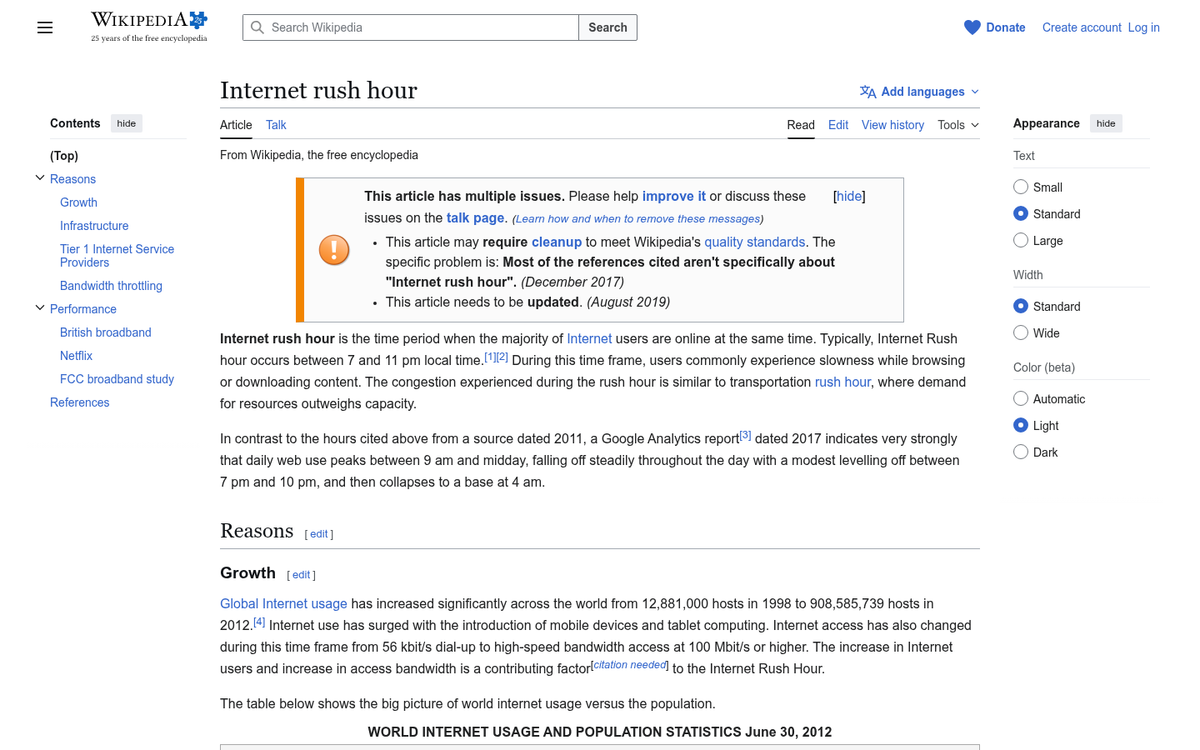
- Global peak internet traffic occurs between 2 PM-3 PM worldwide, with the "Internet Rush Hour" locally falling between 7 PM-11 PM.
- Audience demographics, device type, location, and platform all significantly influence when your specific users are most active online.
- Different platforms peak at different times; LinkedIn performs best midweek, Facebook between 1-4 PM, and Pinterest on Friday afternoons.
- Tools like Google Analytics, Facebook Insights, and Hootsuite help businesses measure their own unique audience activity patterns.
- Brands can train audiences to visit on schedule by consistently hosting recurring events like live streams or weekly newsletters.
Global Trends
Worldwide, as you might expect, peak hours for online activity follow predictable patterns tied to human routines. Think about it like this: you get off work at 5pm, drive home, spend time with your family over dinner, and then sign on to the Internet to check your email or load up Netflix around 7pm. You, and millions of people like you, are doing the same thing at the same time. A few hundred miles west, people are doing the same thing with an hour delay due to a different time zone. Go further west and the delay is longer. Cross the ocean where your 7pm is their 7am and you see the trends reverse.
According to research by Loopex Digital, the busiest hour online worldwide is 2 PM-3 PM, followed closely by 3 PM-4 PM and 5 PM-6 PM. A Google Analytics report also found that daily web use peaks between 9 AM and midday, falling off steadily throughout the day with a modest leveling off between 7 PM and 10 PM, before collapsing to a base around 4 AM.
Of course, broad global data only tells part of the story. Your business doesn't care about peak hours for Internet usage in Ghana. What you care about is your country or, in the case of local businesses, your city.
Regional Trends
Speaking generally, regardless of time zone, you can assume a few things about local Internet usage. The so-called Internet Rush Hour is typically between 7 PM and 11 PM local time. This is when most users have arrived home, completed their commute, shopping, dinner, and other responsibilities, and have settled in for the evening.
For many ISPs, this is a time of heavy load and corresponding bandwidth throttling to ensure smooth flow and a connection free of bottlenecks. This is when many users are signing on to social media sites for the evening, making it a peak time for posting your messages so you can place them in front of as many people as possible. Posting early is recommended to catch them when they're fresh and more likely to engage. On the other hand, you need to avoid posting so early that other businesses overlap your message, shoving you to the bottom of the pile.
Factors to Consider
There's a lot more to consider beyond the basic activity times of your users. For one thing, not all users act the same. A business that caters to a demographic of 60+ year old men and women will find Internet-using habits very different from a business catering to teenagers. Mobile devices throw a wrench into the works with always-available connectivity. Some businesses even cater to users working night shifts, inverting the best peak hours. What factors matter?
Type of action. Facebook users have different timing and browsing habits than Instagram or LinkedIn users, which will differ from readers of your blog. People check their email accounts more frequently than their social media accounts, and will very likely check everything else more frequently than they check your website. Improving your email open rates can help you take advantage of those frequent check-ins.
Audience location. If you're a small local business, the only people you need to concern yourself with are local users. Your peak hours are going to be different than those of the online-only business that caters to a national or global audience with always-open doors.
Audience demographics. The age of your audience tends to have an effect on browsing times. Other demographics, such as employment, religion, and relationship status can have an effect as well. For example, you're not likely to see a large Catholic audience during mass, nor will you see distinct peak hours for the unemployed.
Targeted device. If you're specifically catering to mobile users, you have a bit more freedom. Mobile users tend to check when they have breaks, so you get an extra boost to visibility during lunch, among other times. A surprising percentage of social media users are on mobile, which is worth keeping in mind. On the other hand, desktop users procrastinating during the last few hours of work may check their favorite sites mid-afternoon.
Specifics and Examples
It's not unusual for large companies to run studies to accumulate statistics about peak usage and post timing, publishing infographics and blog posts about what works best for them. Here are some data points accumulated from such studies.
- Facebook posts tend to perform best when posted between 1 PM and 4 PM on any day of the week.
- LinkedIn users are most active midweek - Tuesday, Wednesday, and Thursday.
- Twitter/X users show more activity earlier in the week, with engagement tapering off after 3 PM.
- Pinterest peaks on Friday afternoons.
- Facebook sees its lowest engagement between 8 PM and 8 AM, particularly on weekends.
- LinkedIn users are notably less active on Mondays and Fridays.
- Overall internet activity peaks globally between 2 PM and 6 PM, with the 2 PM-3 PM window earning the highest activity scores in recent research.
- Streaming platforms like Netflix and YouTube now dominate peak-hour downstream traffic, accounting for a substantial share of bandwidth during evening hours.
Measuring Your Audience
Of course, all of the data above is just generalizations. None of it is guaranteed to be applicable to your own personal situation. Your business may be the exception to the rule, garnering a lot of late-evening social activity or strong weekend engagement. Therefore, it's of critical importance to measure your audience, experiment, and discover when your own peak hours happen to be.
Different forms of activity have different means of measurement. Blogs and websites can be measured with Google Analytics 4, which provides detailed real-time and historical audience reports. Facebook and Instagram have built-in Insights dashboards with rich engagement data. LinkedIn Analytics offers similar breakdowns for professional content. Tools like Buffer, Sprout Social, and Hootsuite can aggregate timing and engagement data across multiple platforms in one place.
Make use of these tools and learn when your users are most active and most engaged. Tailor your post schedules to best fit with their activity, so you're always on their minds.
Training Your Audience
Beyond reacting to your audience, you can put a little bit of Pavlov into action. Train your audience to show up at your beck and call, rather than contorting your social efforts to fit with their schedules.
For example, some successful content creators and brands have built recurring weekly events around predictable time slots. A Friday Q&A, a weekly live stream, or a consistent newsletter drop are all examples of this approach. Inform your audience that each week, during a set window, you will be online and actively engaging - through comments, a live video, or a dedicated community post. During that time, you interact with your users, share new content, and generally maintain a hub of activity.
When you do this, your most interested users will come around to see what the fuss is about. When you keep to the schedule from week to week, you'll train your audience to be watchful and show up during those hours to participate.