Running a business online requires a lot of attention. One of the most attention-heavy aspects of it all is analytics. You need to know what's going on with your website and your web business if you want to have a chance at improving it. Sure, you can just throw traffic at it in ever-increasing volumes, but that's a poor use of both time and money.
Think about it this way. If you have a 5% rate of sales, that means 5 out of every 100 people buy your products. That's fine; you decide to advertise until you get 200 visitors. At 5%, that gives you 10 sales; a double in profits. It doesn't scale all that well, though. How many times can you double it? 400, 800, 1,600, and on and on. It costs more and more to reach and attract those people, and you have to broaden your net to catch anyone you possibly can. Your volume goes up, and your profits rise based on that, but your conversion rate drops. 4%, 3%, 2%, until you're at the point where getting more people won't do anything but suck away your ad budget. Keep in mind, the average B2B website conversion rate sits at just 2.23%, so there's often more room to optimize than people realize.
Instead of throwing people and money at the problem, you can look into the statistics on your site. Where are people coming from? Which referrers send the most likely conversions? What demographics make up your readership? When they're on your page, what do they do? When they think about converting, what stops them?
In every sales funnel, there are roadblocks. If there weren't, you would have a 100% conversion rate, and that never happens. By studying your analytics, you learn what those roadblocks are, and you figure out how to fix them. That can help you boost from that 5% to higher, so you don't need to get more visitors to get more profit, and you can get more profit from more visitors. So, what can you track, and how can you track it?
For the most part, this article will be talking about using Google Analytics 4 (GA4) and Meta's tracking tools. There are plenty of other analytics platforms out there too - Hotjar, Clarity, Mixpanel, and Heap among them - and many will provide the same core data in slightly different ways. Feel free to adapt the instructions here to whichever suite fits your workflow best.
Key Takeaways
- Improving conversion rates is more scalable than simply increasing traffic volume, which becomes increasingly costly over time.
- GA4 replaced bounce rate with engagement rate, measuring sessions over 10 seconds, with conversions, or multiple pageviews.
- UTM parameters are essential for accurate social traffic attribution, as GA4 often misattributes or loses referral data without them.
- Combining Meta Pixel with the Conversions API provides more complete conversion data by bypassing ad blockers and browser restrictions.
- Heatmaps and session recordings reveal user behavior that standard analytics events alone cannot capture, helping diagnose UX problems.
Tracking Demographic Information
Demographic information is some of the most basic yet valuable information you can find. It guides virtually every aspect of your business, from your marketing efforts to what products you might have in R&D. If you're making athletic gear for young men, but find out that your marketing is most effective at targeting Latino women, you have a choice to make; do you change your marketing, or do you cater to your new demographic? Without analytics, you might never know that's a question.
In Google Analytics 4, demographic and interest reports are built into the platform under Reports > User > User Attributes. GA4 collects age, gender, interests, and location data through Google signals, which aggregates anonymized data from signed-in Google users across the web. To get the most out of this, make sure Google signals is enabled in your GA4 property settings under Data Collection.
One thing worth noting in 2026: demographic data has become somewhat less reliable across the board as cookie consent requirements have tightened globally. With GDPR, CCPA, and a growing list of regional privacy laws in effect, a meaningful portion of your visitors will decline tracking. In some regions this is a minor issue - research from CookieYes found that in France only about 5% of users never accept cookies, while 28% always accept - but in other markets opt-out rates are much higher. Model your expectations accordingly, and treat demographic reports as directional rather than definitive.
To enable Google signals, go to your GA4 property, click Admin, then navigate to Data Settings > Data Collection. Toggle on Google signals data collection and save. You'll start seeing richer demographic breakdowns within a few days, though you'll want at least a couple of weeks of data before drawing any conclusions.
Facebook - now Meta - still offers one of the most powerful demographic targeting and insight tools available, particularly for paid campaigns. Meta Audience Insights has evolved significantly and now integrates tightly with your ad campaigns, your pixel data, and your Conversions API data. The old reliance on a standalone Audience Insights dashboard has been largely replaced by the audience tools inside Meta Ads Manager, where you can analyze the demographic breakdown of people who engaged with your ads, visited your site, or converted. If you're running affiliate offers through these campaigns, it's worth understanding how to run affiliate links through Facebook Ads effectively.
Grow your Meta audience and make sure the people following your page reflect your actual customer base. The more aligned your social following is with your real buyers, the more useful your Meta demographic data becomes for shaping both paid and organic strategy. You can also check the social signals of your website to see how well your content is resonating across platforms.
Tracking Basic Google Analytics Metrics

It's easy to fall into a trap with Google Analytics. It tracks a lot of data, but some of the most valuable data is hidden behind custom reports and explorations, while some of the data it presents upfront isn't all that actionable on its own. It's nice to see total user numbers, but raw traffic volume tells you very little. I could send a flood of bot traffic to your site and that number would spike overnight - and it would mean absolutely nothing.
One thing that does matter more than ever in 2026: mobile. Mobile devices now generate over 58% of global website traffic, which means if your site isn't fully optimized for mobile users, you're potentially losing more than half your audience before they even get started. Check your GA4 device breakdown reports regularly.
So what metrics should you actually track and pay attention to? Here are some ideas.
- Where your traffic is coming from. How much of your traffic comes from social media versus direct sources versus website referrals versus search results? You can use this metric to see if there's a weak point in your marketing, as well as to measure conversion rates per traffic source rather than just in general.
- Conversion rates for different categories of traffic. You can segment your traffic via a bunch of different metrics and see the conversion rates for each. Traffic source is one option, but you might also consider traffic that converts on the first visit versus traffic that converts as returning users. Returning users are great to target, and that's part of what we'll be looking at with Meta conversion tracking later.
- How many points of engagement does a user make while on your site? In GA4, these are called events, and they can be just about any action a user takes - link clicks, items added to cart, conversions, video views, scroll depth, form fills, and custom events you define yourself. GA4 tracks many of these automatically out of the box.
- Engagement rate. GA4 has largely moved away from bounce rate as the headline metric, replacing it with engagement rate - the percentage of sessions that lasted longer than 10 seconds, had a conversion event, or included at least two pageviews. This is a more useful signal for most sites, though bounce rate is still available if you want it.
- Costs per various metrics. Organic marketing costs money - writing blog posts, advertising socially, and so forth. Paid marketing also costs money, through paid ads, sponsored content, and the like. How many visitors do you get for $1 through various methods? How much does it cost for one conversion, through various sources?
- Value per visit. Not every user who visits is going to buy, but depending on the ways you make money, they can earn you something along the way. How many users need to visit before one converts? Spread the value of that conversion across all of them to get a sense of how valuable each visit is, and segment it by traffic source to see which channels are pulling their weight.
- Entry and exit locations. What are the landing pages when people find you? Are they paid landing pages or are they organic blog posts or product pages? What pages are users on when they leave? Are there pages that are problematic and drive users away, or are most of your users content to read a blog post and leave until next time? If most of your users are abandoning shopping carts at a particular page, there might be a problem you can solve.
- Page speed. This one is easy to overlook in an analytics article, but it belongs here. According to Forbes, about 47% of people leave a site if it takes more than two seconds to load. Your analytics can show you traffic and conversion data all day, but if slow load times are quietly killing your funnel, no amount of optimization elsewhere will fully compensate. Check Core Web Vitals in Google Search Console alongside your GA4 data.
Tracking Visits and Engagement Rate (Accurately)

As I mentioned, GA4 has shifted the primary metric from bounce rate to engagement rate, and for good reason. The old bounce rate definition caused a lot of confusion and misrepresentation of how users actually behaved on a site.
In GA4, a session is considered engaged if the user spent more than 10 seconds on the site, triggered a conversion event, or viewed at least two pages. This is a much more meaningful signal than the old single-interaction bounce definition. That said, bounce rate is still available in GA4 as a dimension if you want it - it's simply the inverse of engagement rate.
The core problem that existed before still exists today: a bounce and a satisfied user can look a lot alike. If someone finds your blog post through Google, reads it thoroughly, gets exactly what they needed, and leaves - what does that look like in your analytics? It looks like a short session with no secondary interaction. In GA4's model, if they spent more than 10 seconds, it at least gets counted as an engaged session, which is an improvement. But it's still not a perfect picture.
One way to get more signal from content pages is to set up scroll depth tracking, which GA4 now does automatically, firing an event when a user scrolls 90% down a page. If a user scrolls to the bottom of your blog post, that's a much stronger signal of satisfaction than a raw session duration. There's a lot you can learn from these engagement signals beyond just a single number.
The bottom line hasn't changed: you simply need to understand what these metrics are actually measuring, and avoid treating any single number as the whole story. If you're noticing unusually low time-on-site figures, it's worth investigating whether the issue is measurement or actual user behavior.
Another important nuance in 2026: with third-party cookies now deprecated in most major browsers, session stitching has become more difficult. A user who visits on mobile in the morning and desktop in the afternoon may appear as two separate users. GA4 attempts to reconcile this through User-ID and Google signals, but it's imperfect. Keep this in mind when interpreting user versus session counts.
Tracking Social Media Referrals

This is going to be a relatively short section, because the fundamentals here haven't changed dramatically - but the execution has gotten more important.
UTM parameters remain the gold standard for tracking where your traffic is really coming from. Google's Campaign URL Builder lets you append UTM parameters to any URL, so when someone clicks a link from your Instagram bio, a LinkedIn post, a Meta ad, or an email newsletter, GA4 knows exactly where that visit originated - not just the platform, but the specific campaign, medium, and content variant.
Without UTM parameters, GA4 will often lump social traffic into "direct" or misattribute it entirely, especially on mobile where referrer data is frequently stripped. This has gotten worse, not better, over time, which makes disciplined UTM tagging more valuable than ever.
Build a consistent naming convention for your UTM parameters and stick to it. Inconsistent tagging - sometimes writing "Facebook" and sometimes "facebook" - creates fragmented data that's hard to analyze cleanly. A simple spreadsheet to manage your UTM links goes a long way.
Tracking Conversions from Meta Ads
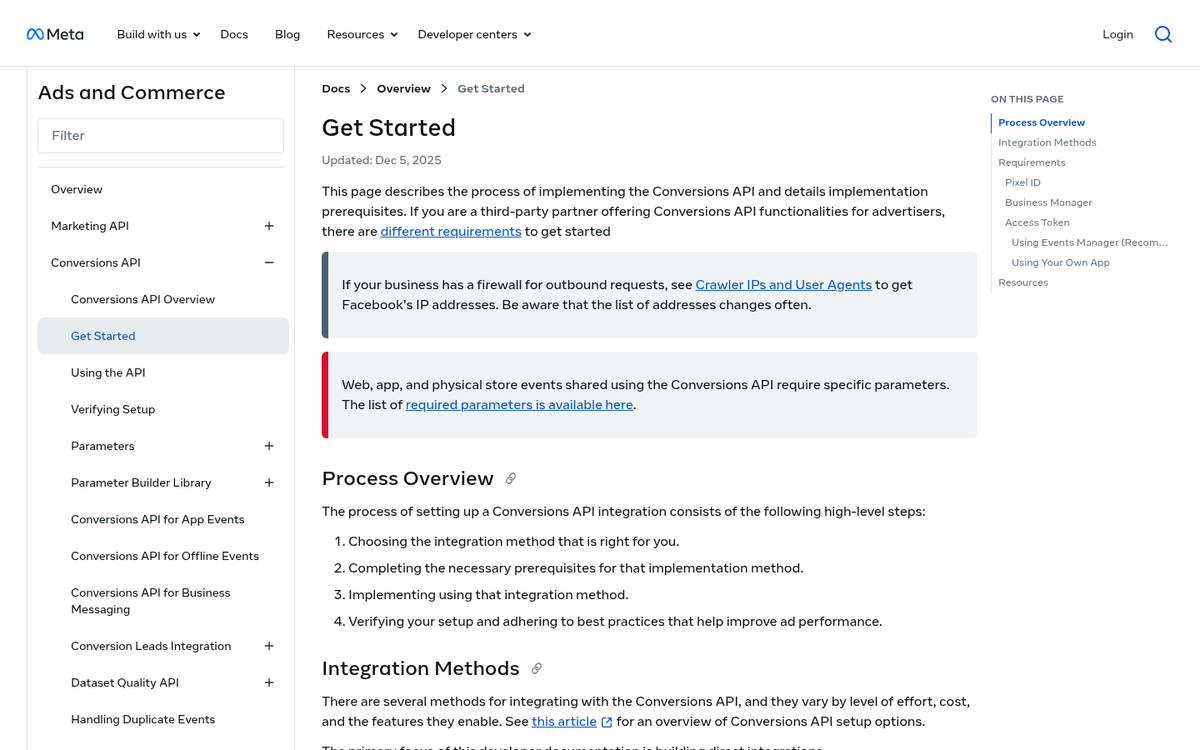
Meta's conversion tracking has evolved significantly from the old single-pixel approach. The Meta Pixel still exists and still works, but in 2026 the recommended setup combines the Meta Pixel with the Conversions API (CAPI).
Here's why this matters: the Meta Pixel fires from the browser, which means it's subject to ad blockers, cookie consent rejections, and browser-level tracking prevention. The Conversions API fires from your server, bypassing all of those restrictions. Used together, they give you much more complete conversion data than either one alone.
Setting up CAPI requires a bit more technical work than dropping a pixel on a page, but most major e-commerce platforms - Shopify, WooCommerce, and others - now have native integrations that handle the heavy lifting. If you're running any meaningful budget on Meta ads, this setup is worth prioritizing.
Once your tracking is in place, you can use that conversion data to build retargeting audiences - people who visited but didn't buy, people who added to cart but abandoned, or people who already converted and might be ready for an upsell. The strategy is the same as it always was; the infrastructure just needs to be more robust in a post-cookie world.
Tracking User Behavior On Page
This is where things get really interesting, and where a lot of the most actionable insights live.
Even with GA4's event tracking, there's a limit to what discrete events can tell you. There's no built-in way to know whether someone carefully read every word of your landing page or closed the tab after two seconds. That's where behavioral analytics tools come in.
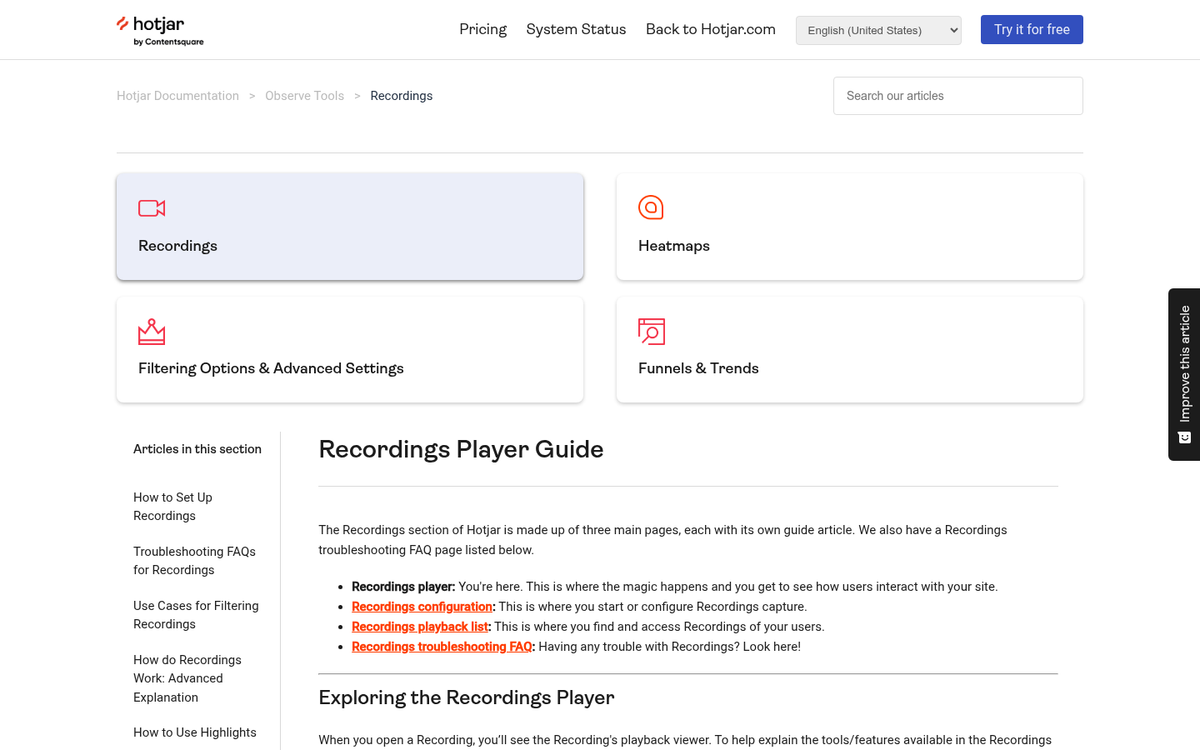
Heatmaps remain one of the best ways to visualize how users actually interact with your pages. Tools like Hotjar and Microsoft Clarity (which is free and has improved substantially) show you click maps, scroll maps, and move maps - letting you see where users are engaging, where they're dropping off, and what they're ignoring. Several free tools can generate these heat maps if you're just getting started.
Click heatmaps are particularly useful for identifying elements that look clickable but aren't, or CTAs that users are scrolling past entirely. If your primary conversion button is below the fold and most users never scroll that far, that's something you can fix - but you'd never know it from GA4 event data alone. This kind of insight is also invaluable when you're trying to improve the landing page experience of your ads.
Session recordings are another powerful tool in the same category. Hotjar, Clarity, and similar platforms let you watch anonymized replays of real user sessions. Seeing a user repeatedly click something that isn't a link, or rage-click a form field that isn't working, is worth more than almost any other data point when it comes to diagnosing UX problems.
One relatively newer development worth incorporating: tools like Clarity now use AI to automatically surface friction points and summarize session recordings, which makes it much faster to spot patterns without having to manually watch hundreds of recordings.
There are also B2B visitor identification tools worth mentioning if you're running a business-facing site. Platforms that use IP-to-company matching can identify which companies are visiting your site with 70-80% accuracy, and some maintain databases of over 50 million companies and billions of IP addresses. If you're in B2B and wondering which accounts are lurking on your pricing page without filling out a form, these tools can fill in a meaningful gap. They're not perfect, but they're a valuable complement to your standard analytics stack.
Now, all of the above is just scratching the surface of how you can use various forms of analytics to understand your customers. The sky really is the limit here; there's so much you can track, so much you can compare, that you can lose yourself in data and never actually make meaningful changes. Don't let yourself get caught up in the numbers so much that you forget to act on them. The important thing is change over time. Make a change to your site and see how your metrics improve or don't. Use your analytics - don't just treat them as a curiosity. It also helps to know which of your pages are actually driving sales so you can prioritize where your optimization efforts go.