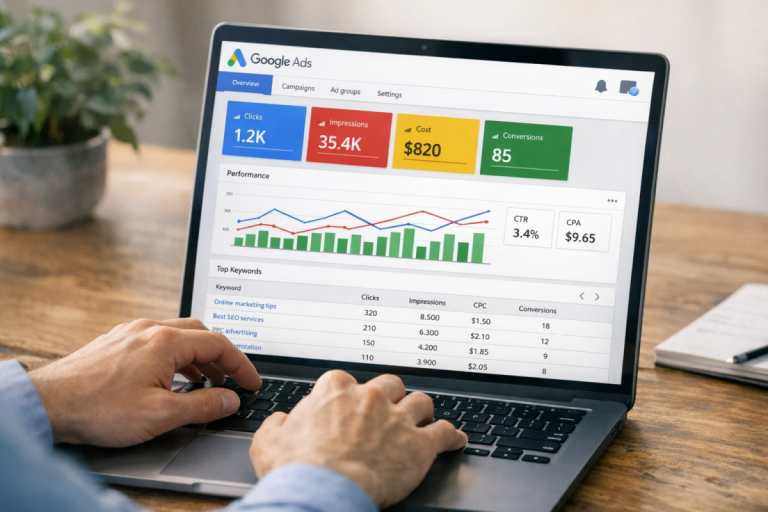
Chances are, people arrive at your site on a wide range of landing pages. Every ad you run has some landing page associated with it, and if you're split-testing landing pages, different ads can have multiple landing pages each. SEO is all about getting as many pages as possible into the upper search results, any one of which can eventually lead to a conversion.
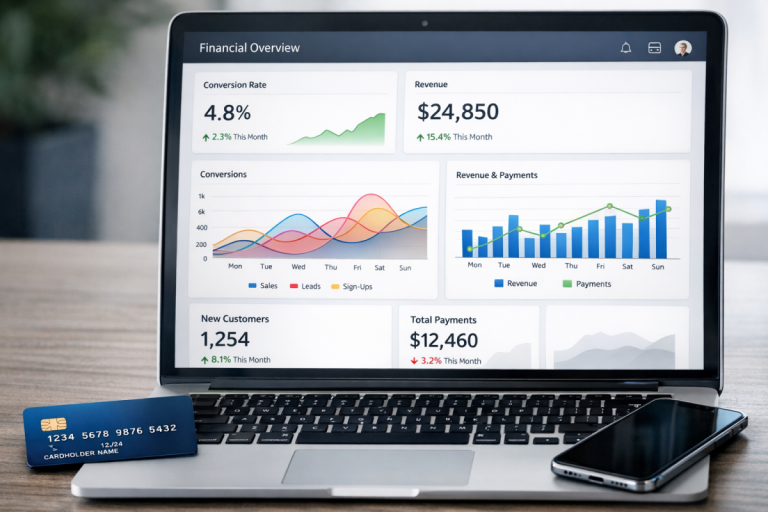
As marketers, we like concrete data. We like to be able to look at a particular page and say "this page has led to X number of conversions over the last 30 days." We like to have this data on hand, so we can see which pages are performing well, which pages are not, and why.
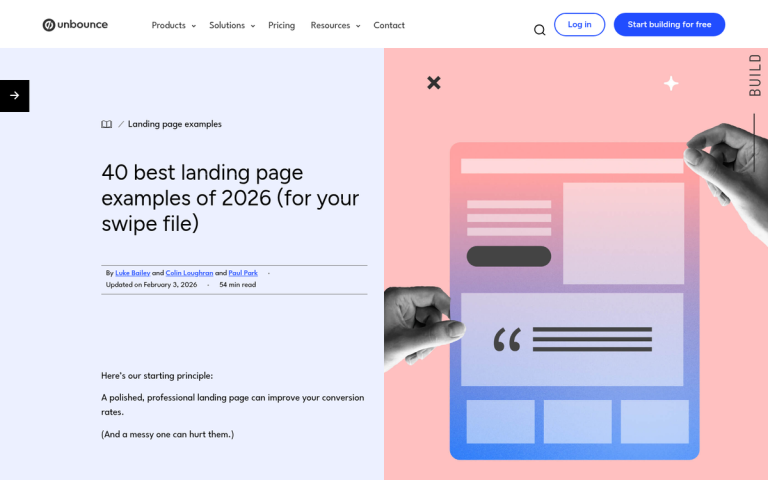
According to Unbounce's Q4 2024 analysis of 41,000 landing pages and 464 million visitors, the median landing page conversion rate across all industries sits at just 6.6%. That number varies significantly by industry - events and entertainment tops the chart at 12.3%, while SaaS trails at 3.8%. Channel matters too: organic search leads all traffic sources with a 16% conversion rate, and email visitors convert 77% more often than those arriving from paid search. Companies with 40 or more landing pages see up to 500% more conversions than those with fewer pages, so there's a strong case for scaling your landing page strategy deliberately.
There are many ways to set up conversion tracking across your landing pages, but the most widely used starting point remains Google Analytics - specifically Google Analytics 4 (GA4), which fully replaced Universal Analytics in 2023. Chances are you already have GA4 installed. If you don't, that's the first thing to address.
Key Takeaways
- The median landing page conversion rate is just 6.6%, but varies widely by industry and traffic channel.
- Companies with 40+ landing pages see up to 500% more conversions than those with fewer pages.
- GA4 tracks conversions through key events, including form submissions, destination pages, button clicks, and scroll depth.
- Use GA4's Landing Page report or Exploration tool to compare which pages drive traffic versus actual conversions.
- GA4 only reports data going forward after events are configured, so early setup is essential for actionable insights.
What Can You Track?
When we think of conversions, we typically think of sales. That said, there are plenty of other actions worth tracking. GA4 allows you to track events such as email opt-ins, contact form submissions, video views, file downloads, scroll depth, button clicks, and live chat connections. While none of these are direct sales, they represent meaningful engagement and lead indicators that can eventually contribute to revenue when properly followed up.
It's also worth noting that page speed directly impacts these numbers. Per Portent, B2B sites that load in one second enjoy conversion rates up to three times higher than those loading in five seconds - so tracking conversions in isolation without monitoring performance is only half the picture.
GA4 Goal and Event Types

GA4 moved away from the old "goal types" model used in Universal Analytics. Instead, everything is now event-based. You mark specific events as "key events" (previously called conversions) within the GA4 interface. The four conceptual categories you'd track still apply, but they're all handled through the events framework:
- Custom events. These cover file downloads, video views, button clicks, form submissions, live chat connections, and more. You can define these manually or use GA4's enhanced measurement settings to capture many of them automatically.
- Engagement-based events. GA4 natively tracks session engagement, including pages per session and session duration, without requiring manual goal setup. You can use these as conditions when building audiences or reports.
- Scroll and interaction events. GA4 automatically tracks 90% scroll depth out of the box, which is useful for identifying whether users are actually consuming your content before bouncing.
- Destination-based events. You can still fire an event when a user lands on a specific confirmation or thank-you page - this is the most reliable proxy for a completed purchase or form submission.
The primary focus here is identifying which landing pages on your site drive the most conversions. To do this, you need two things working together: a key event tied to your conversion action, and a landing page dimension in your reports.
Setting Up Key Events (Conversions)
In GA4, navigate to your Admin panel and select "Key events" under the Data Display section. From here, you can mark any existing event as a key event, or create a new custom event to track a specific action - such as a user landing on your order confirmation page.
For destination-based tracking, the cleanest approach is to fire an event when a user reaches your success or confirmation page. If your confirmation page URL is something like www.example.com/order-confirmed, you would create a custom event triggered when the page_location parameter contains /order-confirmed.
If you have multiple confirmation pages for different products, you can use a "contains" condition rather than an exact match. For example, if all your confirmation pages begin with /success-, you can set your trigger to fire on any page where the path contains /success-, capturing all variations under one event. If you need granular data per product, create individual events with exact-match conditions for each URL. For tips on tracking multiple pixels alongside this setup, see using multiple conversion tracking pixels on a page.
GA4 also supports conversion funnels through the Funnel Exploration report, found under Explore. This allows you to map a multi-step path - from landing page to product page to cart to confirmation - and see exactly where users drop off along the way.
Setting Up Landing Page Reports

Once your key events are configured, the next step is pulling a report that shows which landing pages are driving those conversions.
In GA4, go to Reports > Engagement > Landing page. This report shows you each landing page along with sessions, engagement rate, and - once configured - your key events and conversion rate per landing page. You can customize this report to add or remove metrics using the pencil icon in the top right.
For a more flexible view, use the Exploration tool to build a custom report. Set your dimension to "Landing page + query string" and add metrics including sessions, key event count, and session conversion rate. This gives you a clean side-by-side comparison of which pages bring in traffic and which actually convert it.
One important note: GA4 reports data going forward from when events are configured. It does not apply retroactively to historical sessions, so the sooner your key events are set up and validated, the sooner you'll have actionable data to work with. If you're seeing unexpected results, it's worth reviewing why your landing page bounce rate might be high or exploring proven tweaks to increase landing page conversions.