If you've never explored deep analytics, or you're a typical web user, you might not be aware of heatmaps and how they work to track web users. In fact, the technology just seems a little far-fetched. There's nothing on a website to indicate that it's tracking your every move, after all.
As a business owner, blogger or website manager, however, you should be concerned with heatmaps. They're an incredibly powerful tool for boosting conversions and streamlining the user experience. According to Nielsen Norman Group, websites that use heatmaps and other UX research methods have an 83% higher conversion rate than those that don't. If you've ever wished you could look over the shoulder of your visitors and see exactly what they do, a heatmap is for you.
Key Takeaways
- Websites using heatmaps and UX research methods achieve an 83% higher conversion rate than those that don't.
- Heatmaps track clicks, cursor movement, and scroll depth, revealing how users actually navigate your site.
- Repositioning CTAs based on heatmap data drives real results; one case generated over £10,000 in additional yearly revenue.
- Heatmaps identify distracting or redundant elements, helping you remove clutter and focus users toward conversion goals.
- Popular tools include Hotjar, Microsoft Clarity (free), Crazy Egg, Mouseflow, VWO, and Heatmap.com, many featuring AI analysis.
How a Heatmap Works
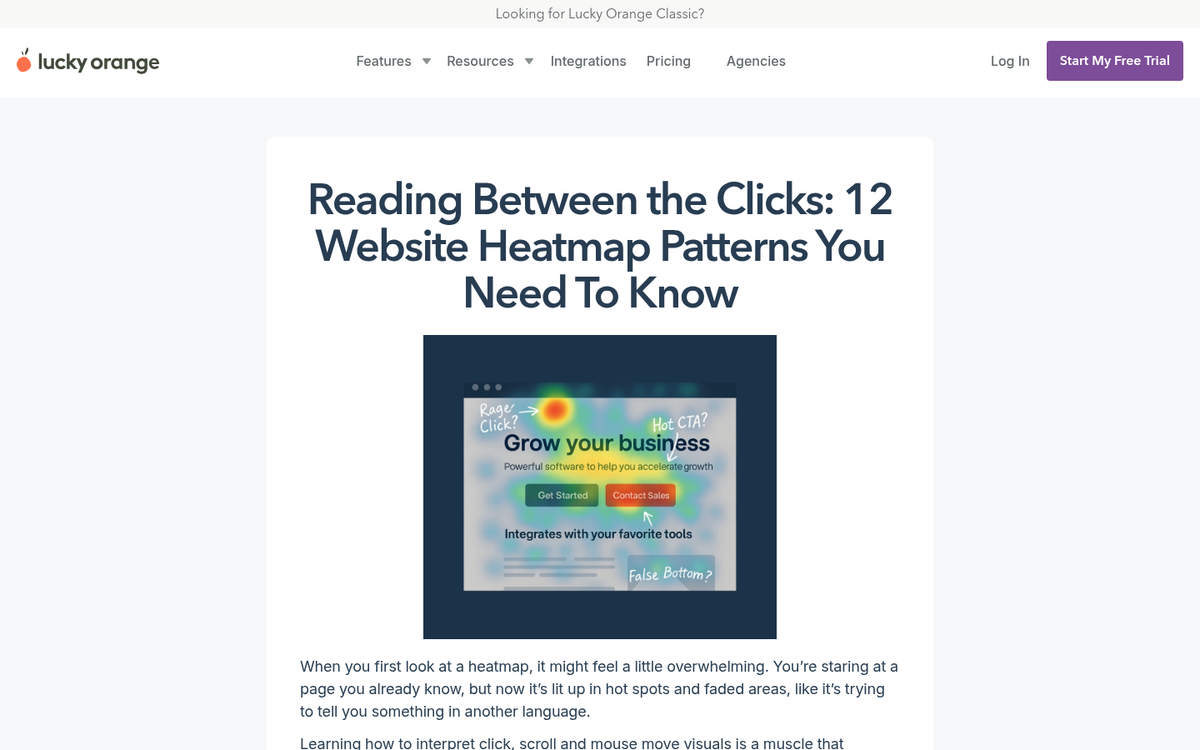
The most basic heatmap is tracking software that records the coordinates on the screen each time the user clicks their mouse. It then overlays this data on an image of your website to show you where attention is concentrated. Areas with more clicks are "hotter" - shown in red, yellow or white. Areas with fewer or no clicks are "colder" - shown in blue, purple or black.
Some more advanced heatmaps go one step further. They track the position of the user's cursor at all times, showing you additional information, such as when a user traces their reading path. This can reveal how a user navigates through drop-down menus without clicking, and other telling gestures. Scroll maps show you exactly how far down the page users typically travel before dropping off - a critical insight for optimizing your layout.
Today's more advanced heatmap tools hardly qualify as traditional heatmaps at all. They log keystrokes, record dynamic session replays that can be played back later, and some now incorporate AI-driven analysis to surface insights automatically without you having to manually interpret the data. If you're looking to get started, there are some free tools available to visualize your website visitor behavior.
The Benefits of Detailed Tracking

What can you see with a heatmap, and how can you use that data?
- Seeing exactly where users click will show you which buttons on your navigation bar are most clicked and which are most neglected. This is particularly useful if you have multiple methods to get from one page to the next, or if you want to see which calls to action are actually getting attention.
- Seeing how far a user scrolls down the page will help you realize how little of your later content is ever seen. CEO Andrew Haehn used a scroll map to reposition a CTA higher on the page, contributing to a 1.1% increase in conversion rate and generating over £10,000 in additional yearly revenue.
- Depending on implementation, a heatmap will be able to track clicks within iframes and other segmented user experience elements, giving you a thorough picture of how users navigate.
- Heatmaps allow you to test various colors, layouts, and placements for buttons and calls to action on your site. Dutch trampoline store Trampoline Plezier moved a CTA using Hotjar heatmap data and saw a 50% increase in clicks.
- A heatmap will show you if there's a particular graphic or element that users expect to be a link but isn't. For example, if your logo isn't linked to your homepage, you'll likely see many users on subpages clicking it in frustration.
Identify the Most Popular Parts of Your Page
By tracking how users interact with your page, you can streamline the user experience. It can be assumed that you have a goal for each page - typically a link you want users to click or a form you want them to fill out. Using a heatmap allows you to see what elements distract users along the way. You can reposition or remove those elements accordingly. Original Grain used element-level data from heatmap tools to identify high-impact areas, resulting in a 17% lift in Revenue per Session while simultaneously scaling traffic by 43%.
Test Headline Styles
Heatmaps on your homepage or article directory allow you to see which headlines attract the most attention. You can test whether a full-size headline, a short truncated headline, a headline with an image, or a full post preview box drives the most engagement and clicks.
Reposition Important Elements
Do you have a button on your navigation bar that seems neglected? Do you have a call to action you want placed more prominently? A heatmap gives you the data to make confident decisions about repositioning rather than guessing. Live Media Crew saw a 7.81% increase in revenue per session and gained $2.5 million in a single month after using an AI-driven heatmap tool to optimize their homepage layout.
Identify and Prune Redundant Links
A typical site has several ways to perform any given action. You might have a social sharing bar in the footer, in a hovering sidebar and in the top navigation. Or, for a link back to your homepage, you might have a "home" nav button, a linked logo and breadcrumb navigation. In most analytics platforms, a click to one link or another looks identical. A heatmap lets you see which of these methods is actually getting used, so you can confidently remove the clutter.
Heatmap Software
Alright, now that you've been sold on the benefits of a heatmap, which software should you use? The landscape has evolved significantly, and there are more options than ever.
Hotjar - One of the most widely used heatmap platforms available today, Hotjar combines click maps, scroll maps, move maps and session recordings in one dashboard. It's particularly popular with marketers and UX teams and offers a free tier to get started. It integrates with tools like Google Analytics, HubSpot and Shopify.
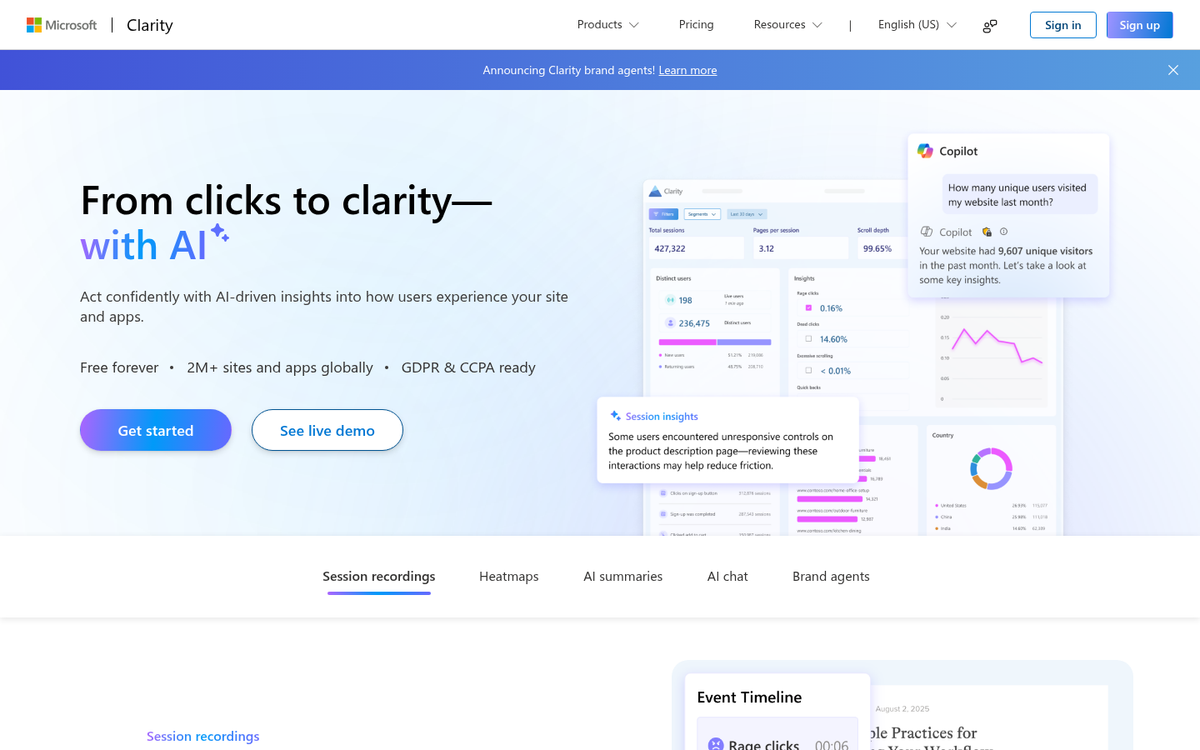
Microsoft Clarity - A completely free heatmap and session recording tool from Microsoft, Clarity has become a go-to for website owners who want powerful insights without paying a cent. It includes AI-powered summaries of user behavior, dead click detection and rage click alerts. It integrates natively with Google Analytics 4.
Crazy Egg - One of the original heatmap tools and still going strong, Crazy Egg offers click maps, scroll maps, A/B testing and session recordings. It's used by major brands and remains a solid, approachable option for teams of all sizes.
Mouseflow - Mouseflow offers a robust suite including heatmaps, session replay, funnel analysis and form analytics. Plans are tiered around the number of sessions recorded per month, making it scalable for growing businesses.
VWO (Visual Website Optimizer) - VWO goes beyond traditional heatmaps by integrating them directly into a broader A/B testing and conversion optimization platform. Research shows that teams using integrated heatmap and testing workflows like VWO achieve 156% higher conversion rate improvements than those using disconnected tools.
Heatmap.com - A newer player focused heavily on revenue-level data, Heatmap.com ties user behavior directly to revenue impact rather than just clicks, making it easier to prioritize what to fix first.
The heatmap space in 2026 is more competitive and capable than ever. Most modern tools now include some form of AI analysis, making it faster to extract actionable insights even if you're not a dedicated data analyst. If you're looking to complement your heatmap data with other tools to track website growth, there are plenty of free options worth exploring.