To an entrepreneur, data is an aphrodisiac. There's nothing quite as sweet as the scent of data wafting from your analytics. Nothing says love quite like knowing your website inside and out. And growth, well, let's just say it's good to make things grow.
Of course, a skilled entrepreneur doesn't approach this relationship unprepared. You bring tools with you. You take a clinical approach, learning your baselines, setting your goals, tracking your progress. It breaks the relationship metaphor, and turns your growth into a science.
And in 2026, that science has gotten a lot more sophisticated. The 2025 industry average traffic split sits at roughly 53% organic, 25% direct, 13% referral, 5% paid, and just 4% social - meaning if you're not watching your numbers closely, you could be pouring resources into channels that simply aren't moving the needle. According to LinkedIn, 67% of small businesses now invest over $10,000 annually in data analytics. The tools you choose matter more than ever.
Key Takeaways
- BuzzSumo helps identify trending content and competitor performance, preventing tunnel vision on your own site's data alone.
- GA4's event-based model offers richer user insights; returning visitors convert at 2-3x the rate of new visitors.
- Split testing tools like Optimizely or VWO remove guesswork from page changes, but tests must reach statistical significance.
- Heatmap tools like Lucky Orange reveal actual user behavior - clicks, scrolls, cursor movement - that Google Analytics cannot show.
- Organic traffic drives over 53% of average site visits, making monthly technical SEO audits via Ahrefs essential.
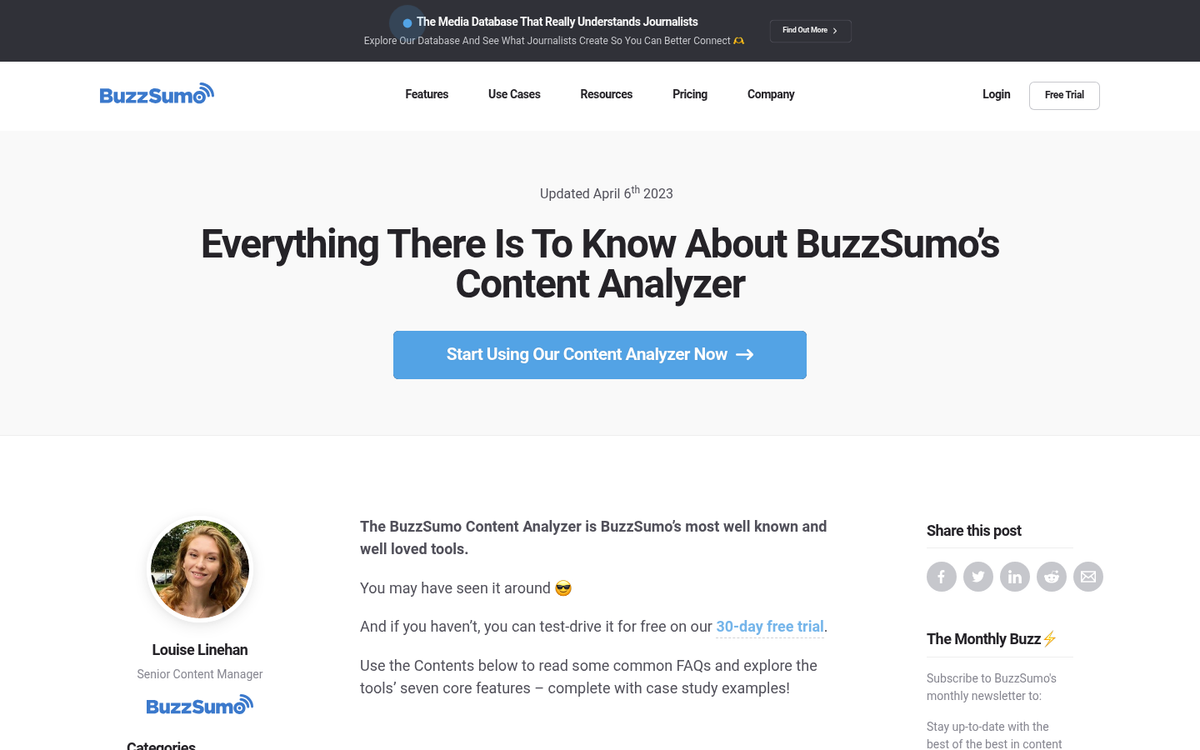
1. Content Analytics with BuzzSumo
One problem that many entrepreneurs fall into is the tunnel vision they have for their own site. You focus on keywords and trends, what works for your site and what doesn't, and you build off what you've been doing. The problem is, just like following a branching forest trail, what you think may be the main route could very well be an offshoot.
Don't quite get it? You're focusing too much on what works for your site and your audience, while ignoring what works for a larger audience that you could be attracting.
The point of BuzzSumo is to give you wide-angle views on the trends throughout the Internet. Put in a keyword and the tool will give you a readout of the best content ranking for that keyword, as well as what sort of social shares the content has. You can tweak your search with advanced filters, save your search to run regularly, filter your data by date range, and export it for use elsewhere.
BuzzSumo has continued to evolve and now includes AI-powered content trend discovery, making it easier to spot emerging topics before your competitors do. The ability to filter by specific types of post remains one of its strongest features - identify the most compelling infographics, videos, interviews, guest posts, or giveaways related to your niche, all in a few clicks.
The competitor tracking side is equally valuable. Where you run a search for a keyword, you can also run a search for a competitor. You can see not just what content is working for a keyword in general, but what's performing best for your specific competition - giving you a clear route to find out how they're doing and outdo them at their own game.
2. Website Data Tracking with Google Analytics 4

It wouldn't be a complete list of website analytics tools without Google Analytics. If you haven't fully transitioned to GA4 by now, that ship has long since sailed - Universal Analytics was sunset back in 2023, and GA4 is the current standard. It's more powerful than its predecessor in many ways, though the learning curve is real.
GA4 is built around an event-based data model rather than the old session-based one, which means you get a much richer picture of how users actually move through your site. Key things to pay attention to in 2026:
- Track your new vs. returning visitor ratio closely. Early-growth companies should expect 80-90% new visitors, while mature sites typically run 65-75% new. Returning visitors convert at 2-3x the rate of first-timers, so a healthy repeat visitor rate of 10-30% is a strong sign of site quality. Below 10% warrants a serious look at your content and user experience.
- Set up conversion events properly from the start. GA4's flexibility here is an improvement, but it requires intentional configuration - don't leave it on defaults. You may also want to explore using multiple conversion tracking pixels if you're running campaigns across different platforms.
- Use the Explorations feature to dig into custom funnels and path analysis that weren't easily accessible in Universal Analytics.
For most growth teams in 2026, the GA4 + Lucky Orange combination covers roughly 95% of what you actually need on a day-to-day basis - pairing deep behavioral analytics with visual session data without overcomplicating your stack.
3. Split Testing with Optimizely (or VWO)
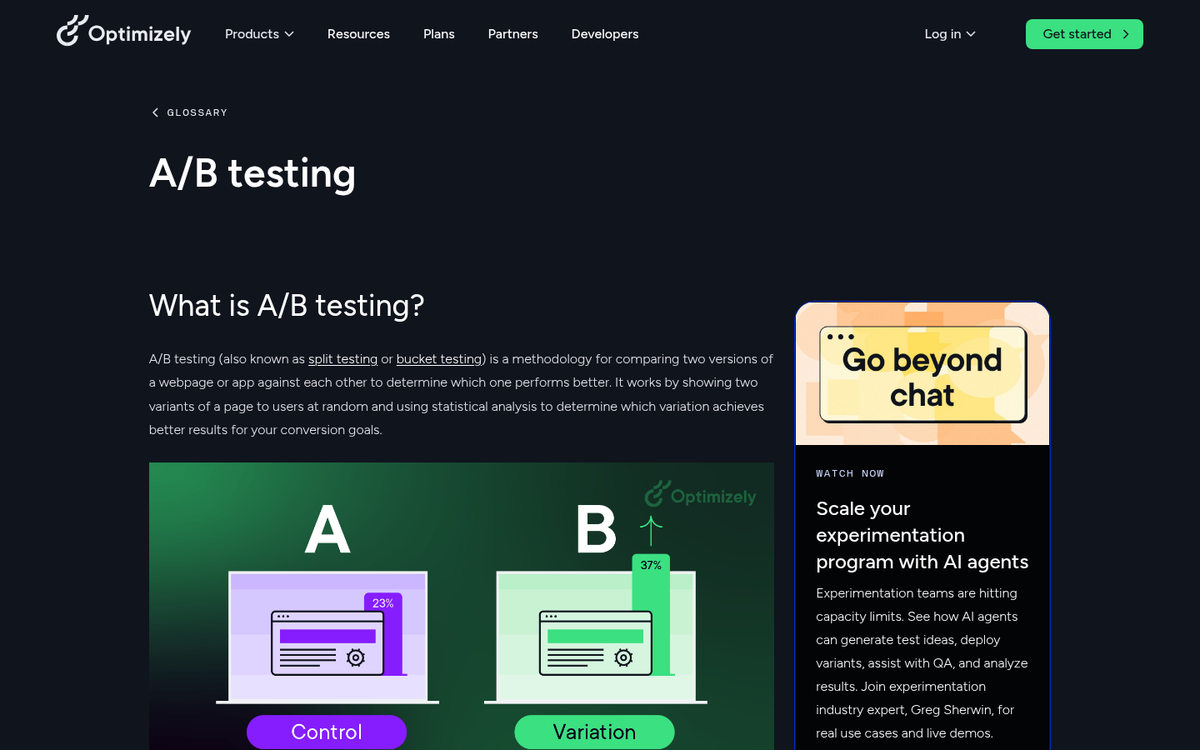
Split testing is one of the easiest ways to try out changes without committing your full audience to one version of a page. It removes time as a variable - both audiences are simultaneous, both versions of the landing page or product page live at the same time. Without it, you're essentially guessing.
Optimizely remains one of the most capable platforms for this, allowing you to plug a code hook into your site and launch split tests in minutes. You can run any number of tests with minor variables changed, and higher tier plans support multivariate testing as well. It has moved increasingly upmarket toward enterprise clients, so if you're a smaller operation, VWO (Visual Website Optimizer) has become a strong and more accessible alternative worth evaluating.
Always take results with a grain of salt and run tests long enough to reach statistical significance. A short spike could be novelty, not improvement. That said, any sustainable, validated increase in conversion is worth chasing.
4. User Experience Optimization with Lucky Orange or Crazy Egg

Some of the most valuable data you can collect is how your users actually interact with your page. You'd never know, for example, if a large portion of your visitors are trying to click an image that looks like a button but doesn't do anything - or abandoning a page because the navigation feels broken to them.
Heatmap tools like Crazy Egg and Lucky Orange solve this. They place a small snippet of code on your site and track where users click, scroll, and move their cursor, producing a graphical overlay of real user behavior. Lucky Orange has become particularly popular in 2026 for its combination of heatmaps, session recordings, live chat, and conversion funnels - all in one dashboard - which is why it pairs so naturally with GA4.
Use this data to streamline your user experience. If users are repeatedly clicking a non-linked image, make it a link. If your navigation sees heavy traffic around one button, reorganize accordingly. This is data you simply cannot get from Google Analytics alone, and it often reveals the "why" behind the numbers you're already tracking.
5. Technical SEO Auditing with Ahrefs Webmaster Tools
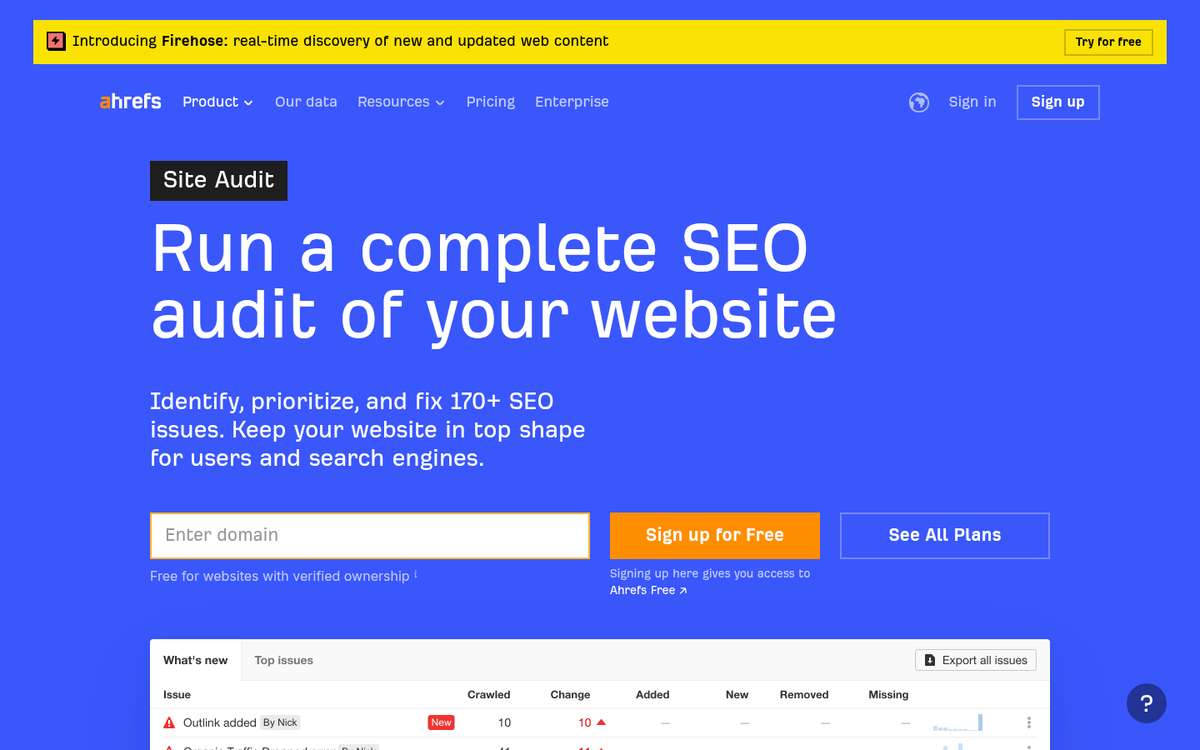
No growth stack in 2026 is complete without a solid technical SEO layer. Ahrefs Webmaster Tools is free to use for your own verified sites and examines your website for over 140 common issues that can impact your search rankings - from broken links and missing meta tags to crawlability problems and Core Web Vitals flags.
Given that organic traffic accounts for over half of the average site's traffic, ignoring technical SEO is leaving your biggest channel exposed. Ahrefs Webmaster Tools also shows your full backlink profile and keyword rankings, making it one of the most complete free tools available for monitoring your organic search health on an ongoing basis.
Run a site audit at least monthly and treat any high-priority issues as urgent. A single crawl error or indexing problem quietly compounding over weeks can do real damage to rankings before you even notice the drop in traffic.
6. Social Presence Monitoring with SharedCount
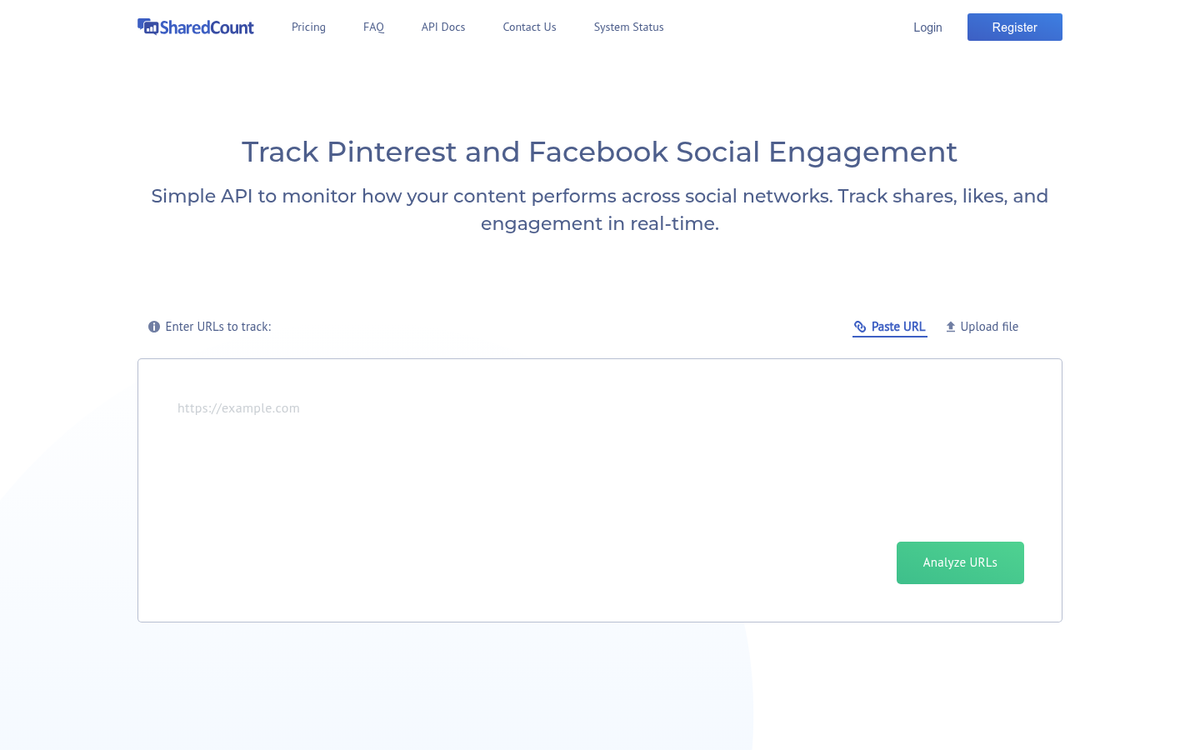
SharedCount remains a simple, useful tool for a quick social share audit. Enter a URL and get an instant readout of the social metrics attached to that piece of content - Facebook likes, shares, and comments, LinkedIn shares, Pinterest pins, and more.
It's not the most robust dashboard, but it gives you access to a wealth of data you can collect and compare over time. Given that social now accounts for just 4% of average traffic for most sites, use SharedCount as a directional signal rather than a primary KPI - but don't ignore it entirely. For content-driven brands, social share velocity on a new post can still be an early indicator of whether something is resonating before organic rankings have had time to develop.