Infographics are an amazing way to present data, and great ones have a good chance of going viral. With the right infographic, you can build a ton of backlinks that stick around long after the initial buzz fades. According to a 2020 study by CMI, 67% of B2B marketers were already using infographics as part of their content strategy - and the case for them has only grown stronger since. Here's how you can make sure those links show up and stick.
Key Takeaways
- Citing data sources visibly encourages original data producers to share your infographic, earning additional backlinks organically.
- The Guestographic Method-offering infographics plus a guest post intro to relevant blogs-can drive significant organic traffic increases.
- Repurposing infographic data into multiple blog posts and guest posts maximizes SEO value and generates additional backlinks.
- Engaging influencers before launch for quotes or previews builds anticipation and increases the likelihood of shares upon release.
- When an infographic loses momentum, accept it and leverage the residual audience gained to give your next infographic a stronger start.
Cite your Data
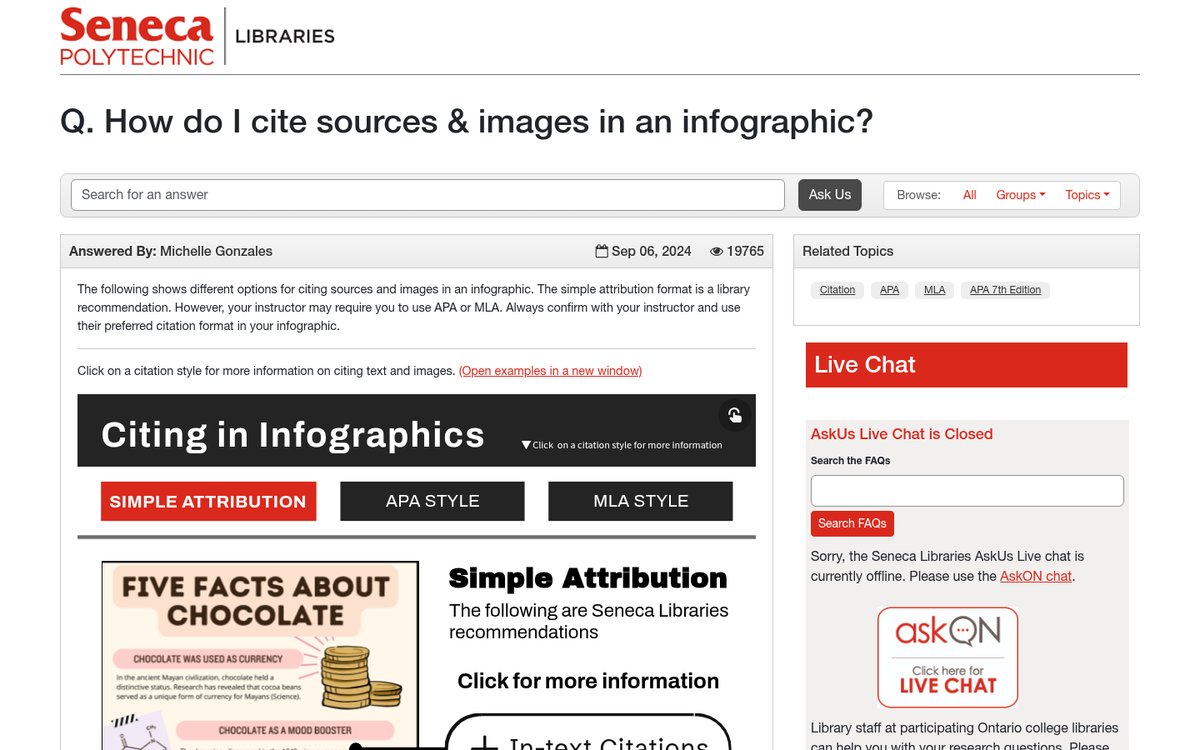
Making sure your data is sound is step number one for a good infographic, but one trick you can use is to cite your data in a visible way. With that little bit of credit, the group that produced the data may take to sharing your graphic, to get themselves a bit more publicity as well. If you produced the data yourself, you might want to find third party verification just to make use of this technique. Neil Patel, who has published over 75 infographics, also recommends keeping your data digestible - no more than 7-10 data points per infographic to avoid overwhelming your audience.
Directory Submission

Hear me out; I know directory submission for articles is a long-dead technique. Directories for infographics, however, can still be decent sources of traffic, recognition, and links. The key is selectivity - you can't just submit to every directory. You need to choose the best ones, those that have real standards and traffic to make it worthwhile. Industry-specific directories would be ideal, but are harder to come by. For a starting point, check out this list of free high-authority directory submission sites.
Press Releases
Again, this is a trick that doesn't work for blog posts, but can work for great infographics, particularly if they contain original data and deep insight that can't be found elsewhere. Targeted press releases are much better than generalized releases, so only submit to industry sources and major publications that might actually run your graphic.
Social Sharing
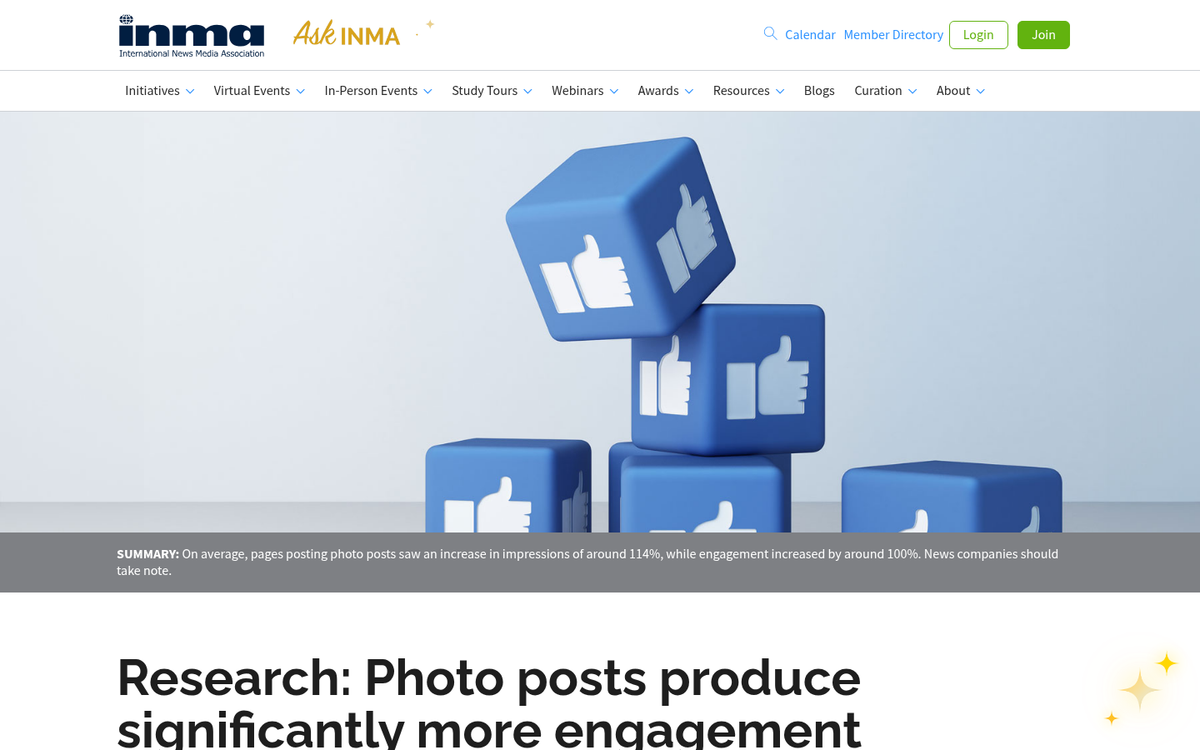
I shouldn't have to tell you to share your graphic on social media, but the data behind it might surprise you. Facebook posts with images receive 2.3x more engagement than those without, and tweets with an image are 1.5x more likely to be retweeted. That alone should motivate you to push your infographic across every relevant platform. Pinterest, Instagram, LinkedIn, and Reddit are all strong targets, though you have to be careful about self-promotion on social media. Consider sharing on personal accounts as well as professional ones to widen your reach.
Hashtag Promotion
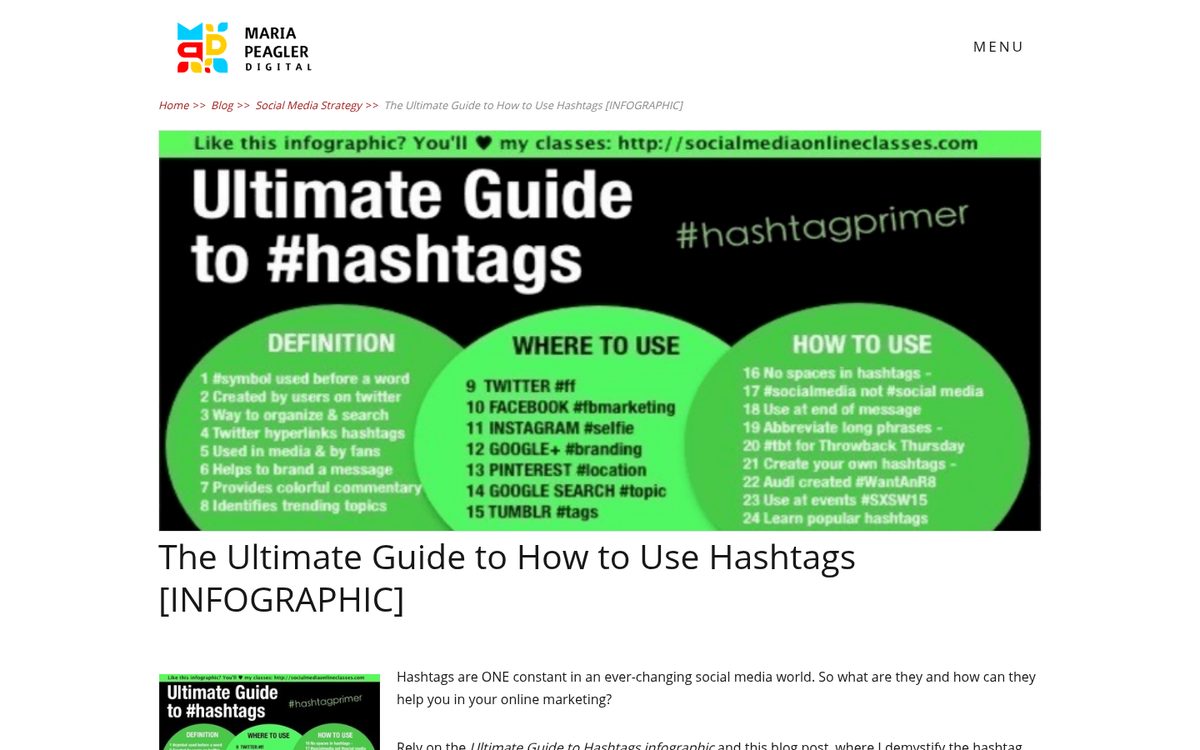
This goes hand in hand with the previous tip; when sharing, don't forget to use hashtags. The simplest is just the #infographic tag, but you should also use industry-related terms, branded terms, and possibly even a special term for the campaign that you embed in the graphic itself.
The Guestographic Method
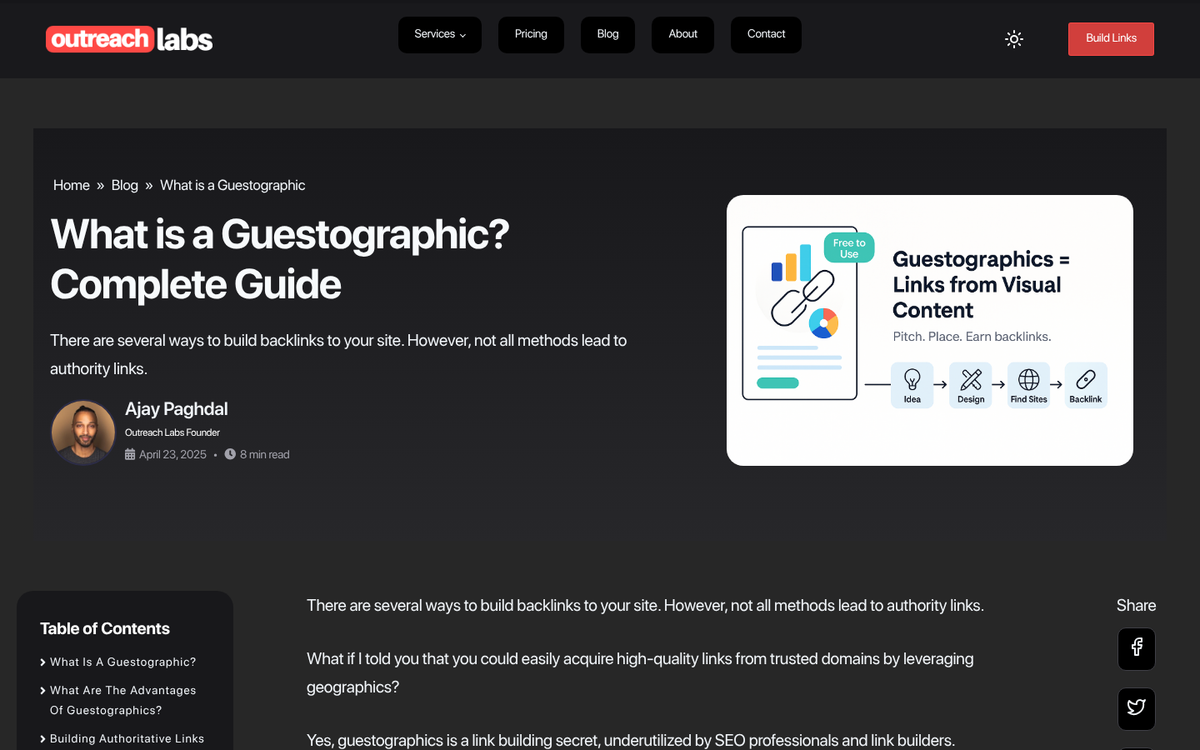
One of the most effective link-building strategies for infographics is the Guestographic Method, popularized by Brian Dean at Backlinko. The idea is simple: create a high-quality infographic, reach out to relevant blogs in your niche, and offer them the graphic along with a short, unique guest post intro to go with it. In one documented case, using this method on an on-page SEO post drove a 175.59% increase in organic search traffic compared to the previous month. Even better, the infographic itself cost only $250 to produce. The return on investment can be exceptional when executed well.
Partner Blogs
In your industry, there will be other blogs with influence and audiences that overlap with yours. You might consider giving a particular blog first shot at publishing your infographic, for the brief boost it will give them. It's curated content, which is great for them, and it links back to you, which is great for you. Win-win all around. Don't rely on this exclusively, though - diversify your outreach so you're not dependent on any single relationship.
Build Upon the Foundation
One of the great things you can do with an infographic is cut it to pieces. Take slices of the image, tidbits of data, and turn them into entire blog posts. Some of these posts can go on your own site, while others can become guest posts on other blogs. Get as much mileage out of the data you gathered as you possibly can, leveraging each and every piece for maximum SEO value - and links back to your infographic page.
Cover a Trending Topic
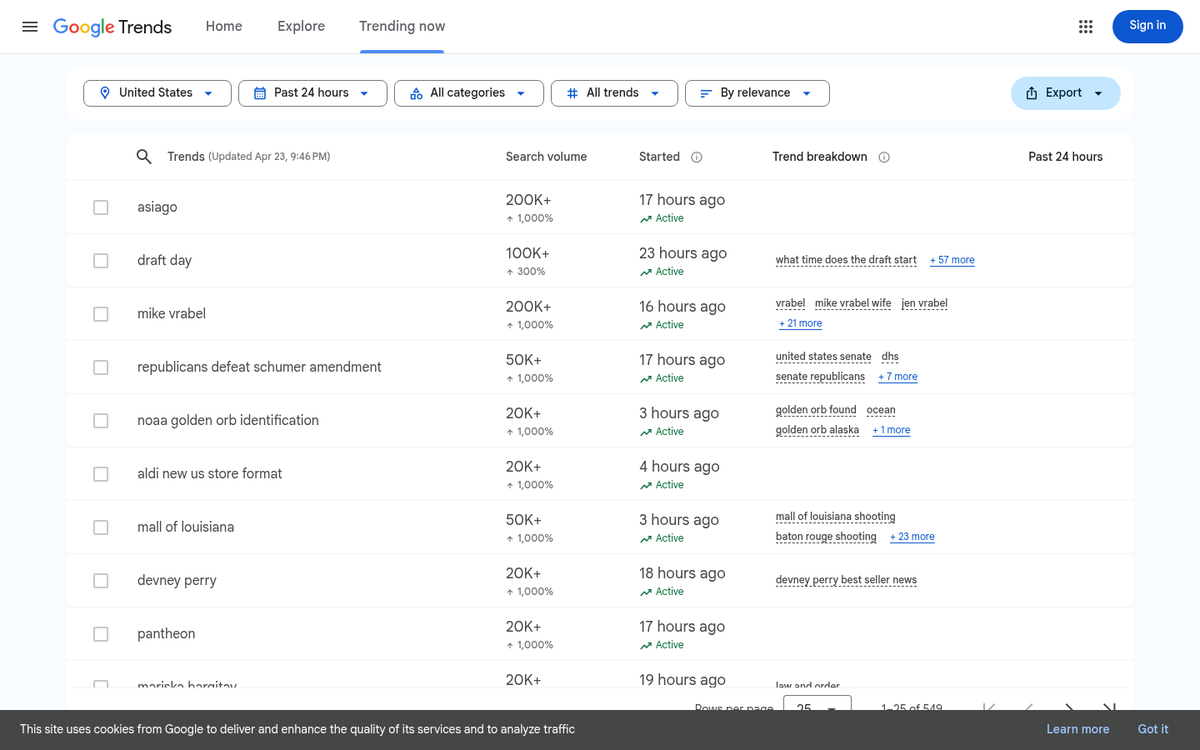
This one requires a bit of agility and resources. If you cover a currently trending topic with your infographic, you have a ready-made audience willing to share your graphic. The key is speed - the sooner you publish after a topic spikes in interest, the better positioned you are to capture traffic while it's still flowing. Tools like Google Trends can help you spot these windows before they close.
Share With Related Blogs
This is very similar to the Guestographic approach, only applied to blogs you don't yet have a relationship with. Run searches for your infographic's subject and locate blogs that have decent traffic and write about your topic. Message the author through a contact form and let them know about your new graphic. You can offer them a guest post intro or share a piece of insider data to sweeten the deal.
Identify Influencers

Every industry has influencers - people who others look to for guidance and information, and who carry real trust within your niche. Identify these people and, when you create a new infographic, send it their way to get their thoughts. A single share from the right voice can dramatically extend your graphic's reach.
Influencer Reviews
A related idea is to contact influencers before you release the graphic. Send them the finished piece and ask for an opinion or a pull quote to include in the accompanying blog post. Alternatively, give them a preview of just part of the infographic, with the full release following on your site. This builds anticipation and gives the influencer a reason to share when it drops.
The Interview

You can limit yourself to one influencer, or you can position yourself as the authority by setting up an interview to accompany the piece. Use the infographic as the foundation for the conversation and let the discussion expand from there. An interview can add significant depth to the piece and give other sites more reason to link back to it.
Seed it Yourself

When you publish something on your blog or business account, leverage your personal accounts for a little extra initial traction. Share it on social sites, post it in relevant communities, and give it a head start before you reach out to anyone else. This early momentum can signal to algorithms that the content is worth surfacing.
Animate it!
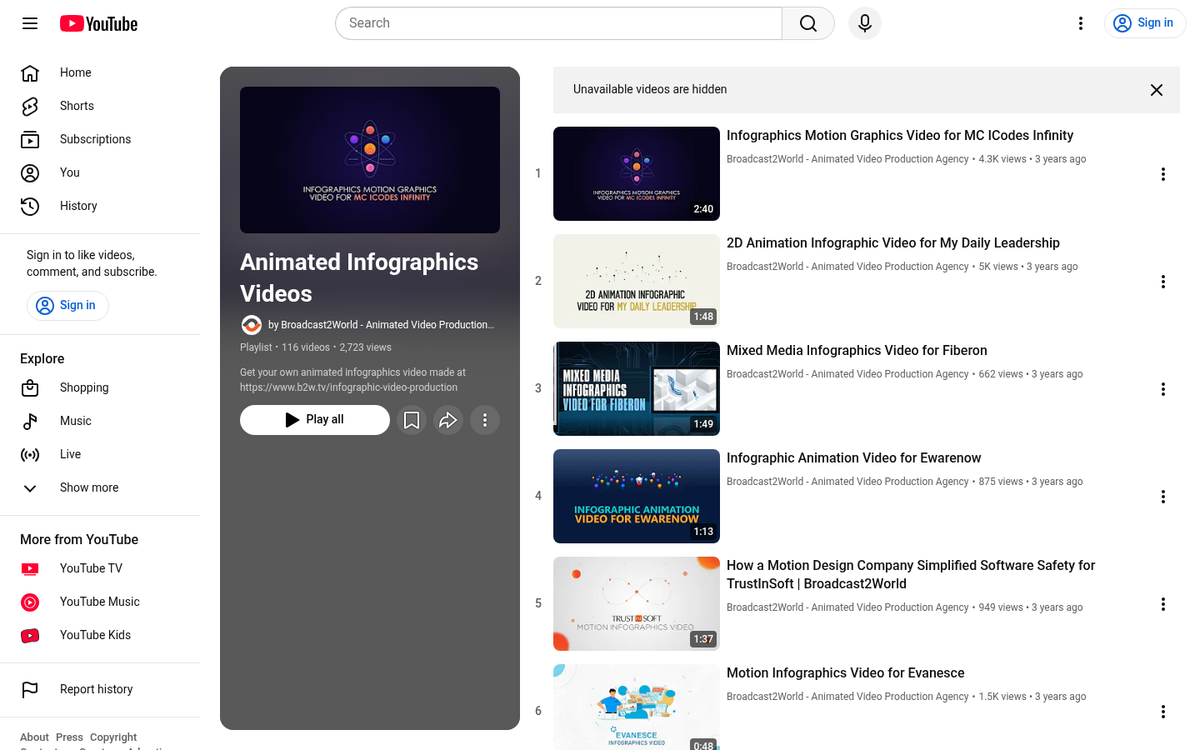
Try taking your graphic and turning it into an animated video. You can then post this video on YouTube or as a native upload to platforms like Instagram Reels, TikTok, or Facebook, and reach an entirely new wave of viewers. This works best when paired with compelling narration rather than just scrolling text and bland background music. Short-form animated infographic content in particular performs extremely well on social platforms in 2026.
Start Fan-First
Instead of starting with an idea and building an audience around it, start with your audience. Ask them what they want to know about your industry, then turn around and deliver that data in infographic form. This approach almost guarantees engagement because you're giving people exactly what they already said they wanted.
Think Outside the Box

The more creative, unique, and original a graphic is, the easier it is to share. Try to be exceptional in some way - whether that's the visual design, the angle of the story, or the exclusivity of the data - to make your graphic stand out and earn the attention it deserves.
Add to Discussions

Industry forums, LinkedIn group, Reddit threads, Slack communities, and hashtag conversations are all places where people actively discuss your topic. Check them out and see if there's a natural way to work your link into the conversation. Be genuine about it - forced self-promotion is easy to spot and often backfires.
Make it Seem Exclusive

It may seem counter-intuitive, but you may want to make it harder for users to see your graphic. If you place a great graphic behind an email opt-in, it makes it feel more valuable and exclusive. You get to build your mailing list and establish authority at the same time.
Accept Rejection

If your graphic is rejected or people refuse to share it, don't force it. Let it sit and study it honestly. Why was it rejected? Does it lack narrative depth, a compelling hook, or is it too narrow for the audience you targeted? Figure out what didn't land and apply those lessons to your next one.
Don't Fight the Inevitable Death of the Graphic
Sooner or later, your graphic is going to run out of steam. Don't try to artificially keep it alive - it'll be a losing battle. Instead, start work on your next graphic and capitalize on the residual audience you gained from the first one to give the next one a stronger head start.